A 15-month rally has taken copper futures to an interesting price area. Traders who pay attention to Elliott wave patterns may wish to begin monitoring copper during the remainder of the year with the expectation of a pause or even a large-scale reversal.
Rapid upward or downward moves in copper are not the norm. Looking at charts going back to 1988, all of the really strong rallies have lasted from 12 to 15 months before consolidation or reversal kicked in.
The price of copper also tends to behave in a range-bound fashion, and a test of the edge is usually followed by a reversal. Prior to 2005, futures stayed within the range of approximately 1.00 to 1.85. Then price heaved itself into the new range of 1.90 to 5.15 that it has inhabited since. Currently price is approaching the upper edge of the new range.
Another characteristic of copper prices, as with many other commodities, is a tendency to form three-wave structures during spans of several years. Viewed with an Elliott wave methodology, these structures count as corrective, although the final segment of each structure is typically impulsive. That describes the price action from 2006 through 2008, which ended with a downward impulse. It may also describe the action from 2016 until the present, which appears to be ending with an upward impulse.
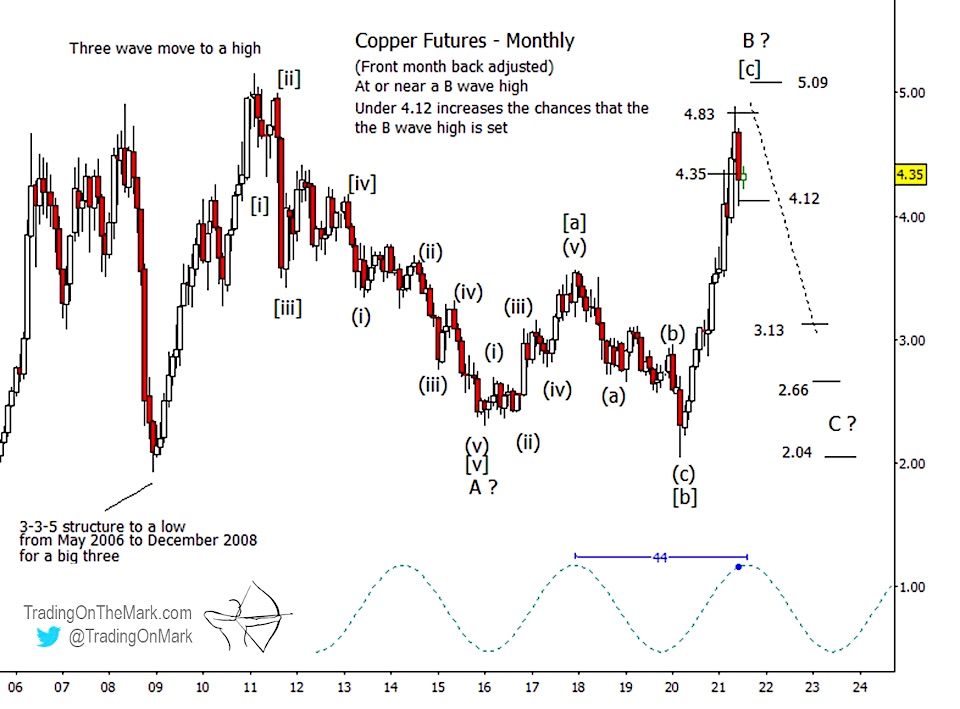
At the scale of a monthly chart it is not yet clear whether the upward impulsive wave [c] of B is finished. We believe it can stretch for one more high, perhaps testing the 5.09 area. However it is also possible to make a case for the move being finished. The weekly chart below shows more detail.
Our primary scenario for the upward move since 2020 has price currently in corrective sub-wave (iv) of [c] of B, with an expectation of one more high as sub-wave (v). On a weekly time frame, there are resistance targets near 5.09 and also 5.43.
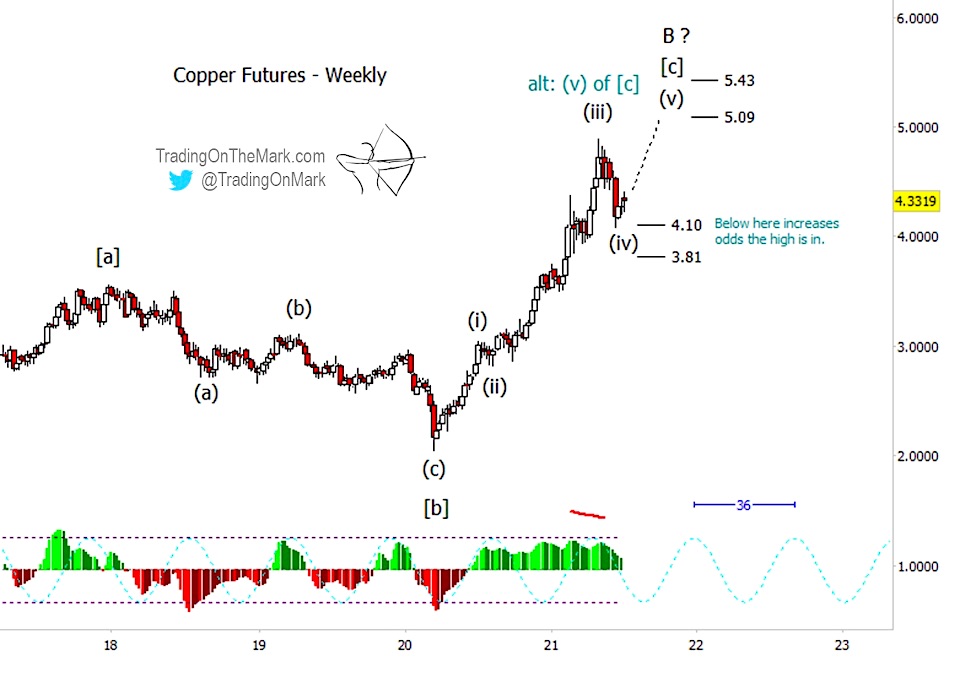
As an alternative scenario, the upward move might already have printed five waves, meaning the high might already be in. A decisive breach of support at 4.10 would provide initial confirmation of the bearish alternative, and a failure of the next support at 3.81 would solidify that view.
Trading On The Mark provides detailed, nuanced analysis for a wide range of markets including crude oil, the S&P 500, currencies, gold, and treasuries. Sign up for free market updates via our page on Substack and follow us on Twitter for more charts.
Twitter: @TradingOnMark
The authors may have a position in the mentioned securities at the time of publication. Any opinions expressed herein are solely those of the author, and do not in any way represent the views or opinions of any other person or entity.


