Interest rates remain in the spotlight with investors watching every economic data release and wondering when the Federal Reserve will stop raising rates.
Well, one way to gauge this environment is to watch the 10-Year US Treasury bond yield. And as you guessed, it’s been heading higher for a while now.
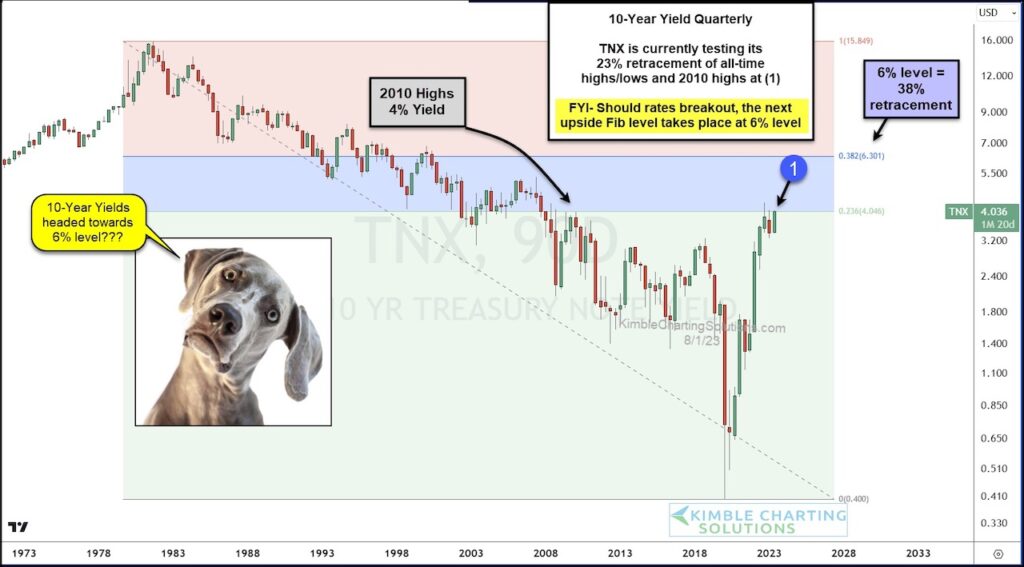
And today’s long-term “quarterly” chart highlights an historic Fibonacci breakout resistance level at (1).
The 10-year yield is testing the 23% Fibonacci retracement level right now. This is a HUGE test for yields continues.
And should the 10-year breakout and close the quarter above (1) it would open up the potential for yields to move to the next Fibonacci target around 6%. There’s a lot at stake here for consumers and bond traders! Stay tuned!
10-Year Yields “Quarterly” Chart
Note that KimbleCharting is offering a 2 week Free trial to See It Market readers. Just send me an email to services@kimblechartingsolutions.com for details to get set up.
Twitter: @KimbleCharting
Any opinions expressed herein are solely those of the author, and do not in any way represent the views or opinions of any other person or entity.


