The commodities complex is mixed but still showing some inflationary pressures. Sure oil has rallied on Iran war fears, but it’s still off its highs.
Outside of energy, we see some agriculture commodities and sectors showing strength.
One stock I’d like to highlight today is Archer Daniels Midland (NYSE: ADM).
ADM has rallied to new multi-month highs but is pulling back and might retest an important breakout area.
Note that the following MarketSurge charts are built with Investors Business Daily’s product suite.
I am an Investors Business Daily (IBD) partner and promote the use of their products. The entire platform offers a good mix of tools, education, and technical and fundamental data.
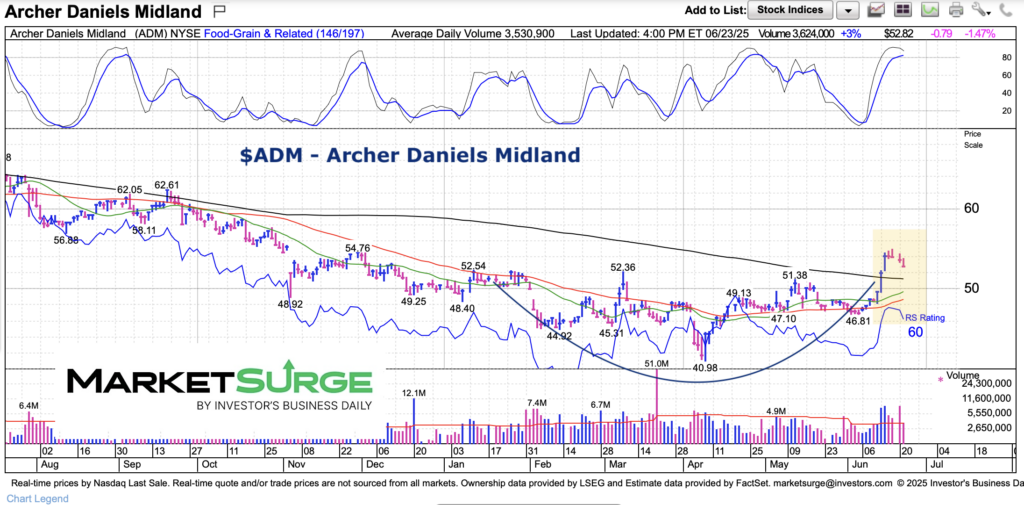
$ADM Archer Daniels Midland Stock Chart
Here we can see ADM’s breakout above $52 and out of a nice basing pattern. It is pulling back right now and looks like it may retest this breakout area as well as the flattening 200-day moving average. Holding above $50 is key. The would indicate that the trading trend is in tact.
Twitter: @andrewnyquist
The author may have a position in mentioned securities at the time of publication. Any opinions expressed herein are solely those of the author, and do not in any way represent the views or opinions of any other person or entity.


