April 1 stock market futures looked lower early this morning as a brief bounce last night on China PMI numbers was sold. The S&P 500 futures chart resumed its downward move but deeper into support.
Since then we have made a lower low over night once more (short term trend formation), likely following the lead from oil which is also moving down. A bounce off strong support near 2039.5 to 2041.5 targets 2044.75(where we battle currently), followed by 2047.75, 2051.5, and 2057.75.
The charts seem tired to me, so I do not expect any range expansions or big bounces to hold, but buyers should bounce us… perhaps into a lower high.
Momentum on the four hour chart of S&P 500 futures is bullish, so buyers remain in control, but tighter time frames still suggest a pullback into support before any bounce.
Shorter time frame momentum indicators are negative but we are coming into congestion and support. Downside motion should be limited, however, as the balance between buyers and sellers seem even in the neutral zone. A steep selloff will likely find buyers coming in to hold levels.
See today’s economic calendar with a rundown of releases.
THE RANGE OF THURSDAY’S MOTION
Crude Oil Futures (CL_F)
Sharp downward motion in the chart continues with targets near 37 on the horizon. Buyers show little strength and are sitting on the sidelines waiting for the value areas
Today, the trading ranges for crude oil are between 36.95 and 38.89- support areas near 37.34 and resistance near 38.42.
Moving averages in oil still show continued coiling on the daily but have shifted negative on tighter time frames, and negative momentum on longer intraday time frames that continues to lift on the weekly time frame. Resistance is now lower between 39.89 and 39.65; deeper support is likely near 37.59 and 37.36.
Intraday long trading setups on crude oil futures suggest a long off a 37.34 positive retest (check momentum here), or 38.14 positive retest on the pullback into targets of 37.51, 37.96, 38.14, 38.42, 38.94, 39.46, 39.74, and if buyers hold on, we’ll see 40.1 to potentially 40.46, and 41.04.
Intraday short trading setups suggest a short below a 37.78 failed retest with negative divergence, or the failed retest of 37.3 sends us back through targets at 37.69, 37.43, 37.28, 37.01, and 36.85, if sellers hang on.
E-mini S&P 500 Futures (ES_F)
Below is a S&P 500 futures chart with price support and resistance trading levels for today. Click to enlarge.
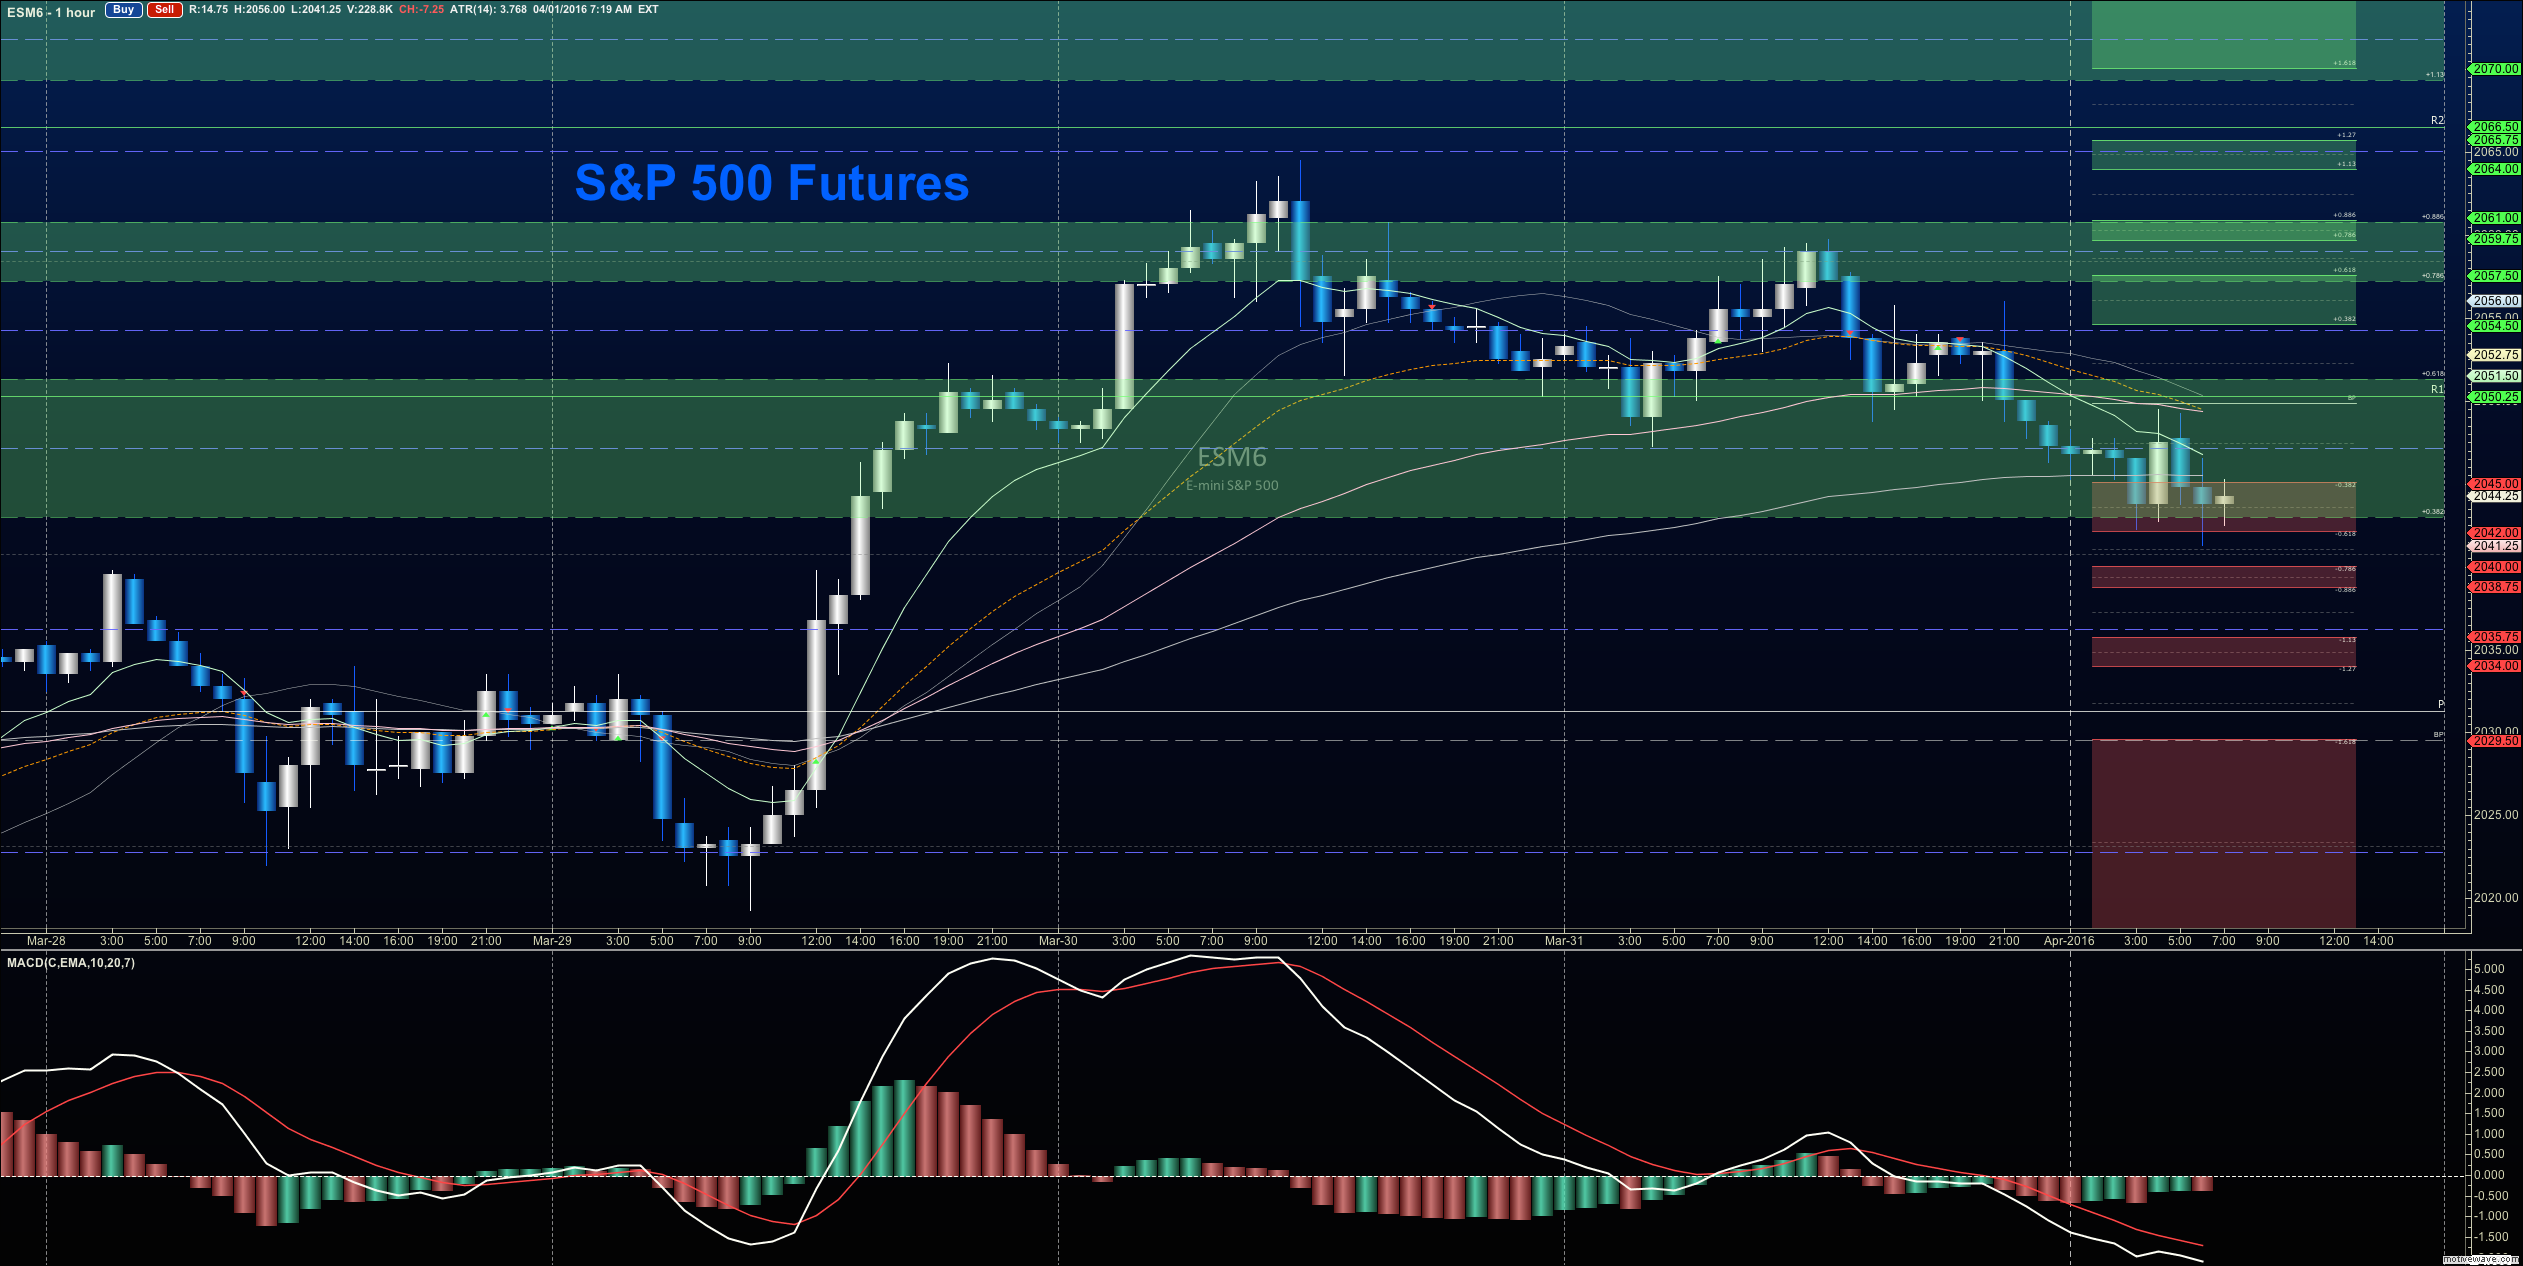
The artificial tandem that traders are building with the oil chart helped with the ES_F drift down overnight as sellers try to take more control. The levels between 2051.75- 2059.25 serve as front line resistance, with 2039- 2041.5 now as support. Stretches north could see 2059.75 and deep support could now be near 2032.5. For now, buyers are now waiting on the test of value areas to try a surge forward pressure to hold. But bounces are likely to be sold.
Upside motion (countertrend intraday) has the best setup on the positive retest of 2038.75 or a breach and retest of 2036.5 with positive momentum. I use the 30min to 1hr chart for the breach and retest mechanic. Targets from 2039.75 are 2041.5, 2044.5, 2047.5, 2051.5, 2054.5, 2055.5, 2057.75, and if we can catch a bid there, we could expand into 2061.5, 2064.25, and 2067.5. Longs are still trending over the bigger picture for now, but momentum remains damp and the short term cycle downward is continuing.
Downside motion (trending intraday) opens below the failed retest of 2049.5 or at the failed retest of 2051.5 with negative divergence. Retracement into lower levels from 2049.5 gives us the targets 2047.75, 2044.25, 2041.75, 2039.5, 2037.5, 20.25, 2039.75, 2035.75, 2033, and perhaps 2029.5 if selling really takes hold (clearly possible if buyers lose their footing, or lower highs continue to develop).
If you’re interested in the live trading room, it is now primarily stock market futures content, though we do track heavily traded stocks and their likely daily trajectories as well – we begin at 9am with a morning report and likely chart movements along with trade setups for the day.
As long as traders remain aware of support and resistance levels, risk can be very adequately managed to play in either direction as bottom picking remains a behavior pattern that is developing with value buyers and speculative traders.
Thanks for reading.
Twitter: @AnneMarieTrades
The author trades stock market futures every day and may have a position in mentioned securities at the time of publication. Any opinions expressed herein are solely those of the author, and do not in any way represent the views or opinions of any other person or entity.


