Today I am going to take a look at Apple’s stock (AAPL) and discuss the recent price action… along with the AAPL yearly pivots.
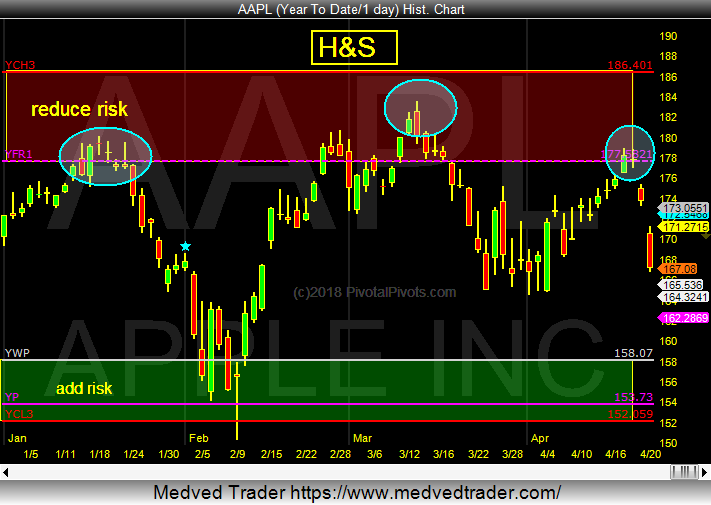
The stock has moved lower over past few days. The move lower has comes from a price area that I highlighted early in the year as an area to reduce risk.
This area starts at the AAPL yearly resistance pivot (YR1). See the chart below.
This chart looks very similar to Apple in 2015… when $AAPL made a head and shoulders top at the yearly R1 pivots.
Is APPLE making a head and shoulders top in 2018 too? The neckline is the yearly pivot at $152. A close below that would open the door for the yearly S1 pivot at $130.
Yearly pivot points shows us where to add and reduce risk.
Apple (AAPL) Stock Chart with yearly pivots
The indicators that I use on my price charts are called Pivot Points. They are a mathematical calculation based on the previous periods high, low and close.
Learn more about these key price pivots at on Pivotal Pivots or catch me on Twitter.
Twitter: @Pivotal_Pivots
The author may have a position in mentioned securities at the time of publication. Any opinions expressed herein are solely those of the author, and do not in any way represent the views or opinions of any other person or entity.


: Showing Some Signs of Emerging Strength")
