Everything appeared to be coming up roses for stocks this week. Even after the Fed announcement, the S&P 500 jumped back above 2000. But that would prove to be short-lived. But even the pre-FED bout of equities strength wasn’t enough to push Apple (AAPL) through a key technical resistance level.
And since Apple is a market leader and one of the most-owned stocks, it’s important to monitor it for “event” like technical moves.
Back on September 8th, I wrote about Apple’s rally off the August 24 lows. It was impressive, no doubt, but it hadn’t quite gotten AAPL out of the woods. In short, the chart was broken and Apple was trading under key resistance levels.
Here’s what I wrote:
[A retest] can only occur when the current rally has run its course. And Apple may still have some legs near-term (I’m watching the overhead moving averages). Note the falling 50 day moving average pierced the flattening 200 day moving average.
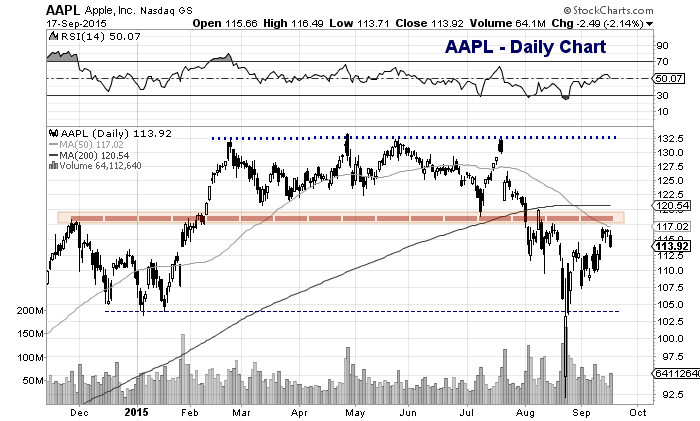
Why? Well first of all, it suffered a lot of technical damage. And, as a market leader, that’s concerning. As well, it’s steep decline likely created several levels of overhead supply as investors/traders went into the red (i.e. they will try to recoup losses on rallies). Note that the 50 day moving average is still falling (now at $117) and the 200 day is flat at $120 and change. The bulk of technical resistance lies within that area ($117-$120)… and Apple has yet to conquer it.
The longer AAPL sits around $110-$115, the more likely a retest of the lows becomes (partial or full).
So is there anything bullish about AAPL’s chart here? There is the potential for an inverse head and shoulders pattern. It’s showing some relative strength thus far today. And if Apple can hold the $110/$111 area and breakout above $120, it would be a huge positive for bulls. But that’s a big “if”.
The chart below has simply been updated with new bars (no other changes). The bears are still in good shape with AAPL under $120. The bulls need to see AAPL overtake the 50 day MA (to neutralize the situation), then overtake the 200 day MA to regain control.
Apple (AAPL) Stock Chart
Thanks for reading.
Twitter: @andrewnyquist
The author does not have a position in any of the mentioned securities at the time of publication. Any opinions expressed herein are solely those of the author, and do not in any way represent the views or opinions of any other person or entity.


