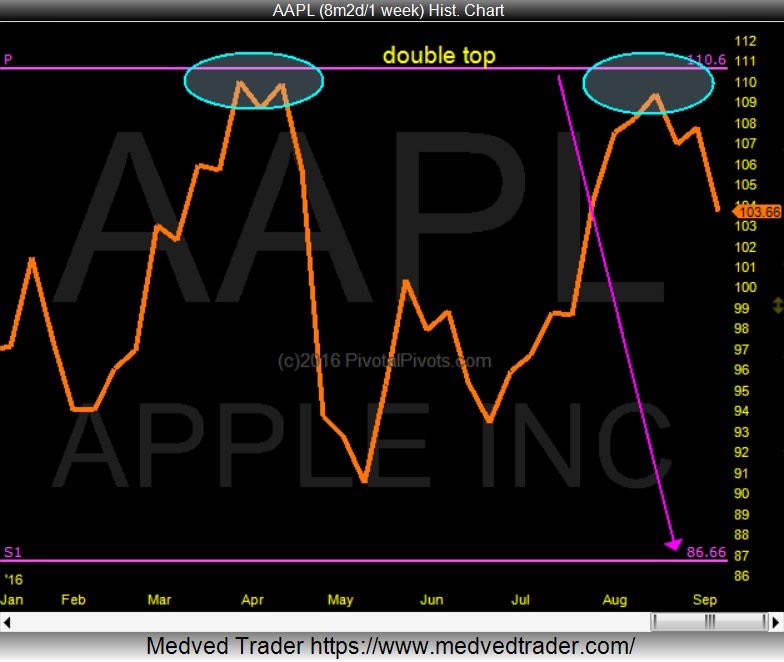
Just when Apple’s stock price looked like it was almost out of the woods, it stalled at key price resistance. And since Apple (NASDAQ:AAPL) has formed a double top at it’s Yearly(P) Pivot at $110, its stock price may be headed to the YearlyS1 pivot at $86.66 sometime by the end of 2016.
This happens 74 percent of the time when price fails at the Yearly(P) Pivot resistance.
With this in mind, traders could trade against $110ish… bears using that area for stops on short positions and bulls holding out for a confirmed breakout above this price area.
Also read: Stock Chart Parallels: Chipotle 2016 vs Apple 2013
The 2015 high on Apple was at its YearlyR1 pivot($133). Will the 2016 low be on the YearlyS1 Pivot?
Thanks for reading.
Twitter: @Pivotal_Pivots
The author does not have a position in mentioned securities at the time of publication. Any opinions expressed herein are solely those of the author, and do not in any way represent the views or opinions of any other person or entity.


