After all this work, I then go back to the weekly chart of $AMZN and look for a “logical” count. To me, I see 5 waves completing in and around the price target areas shown.
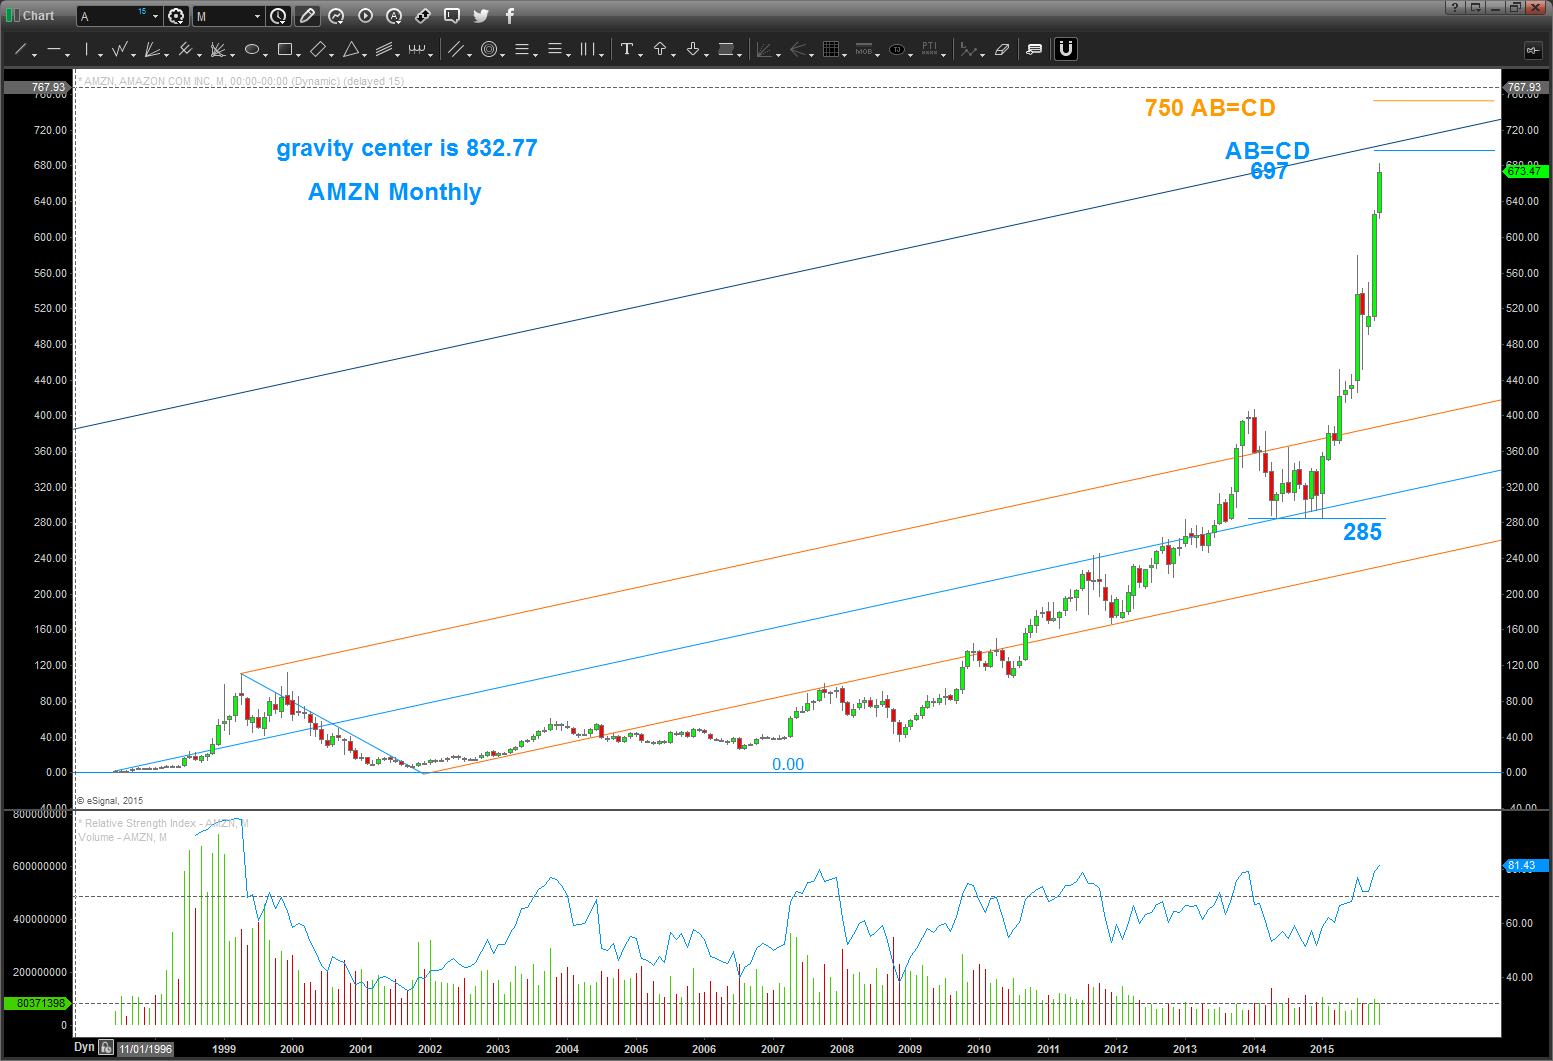
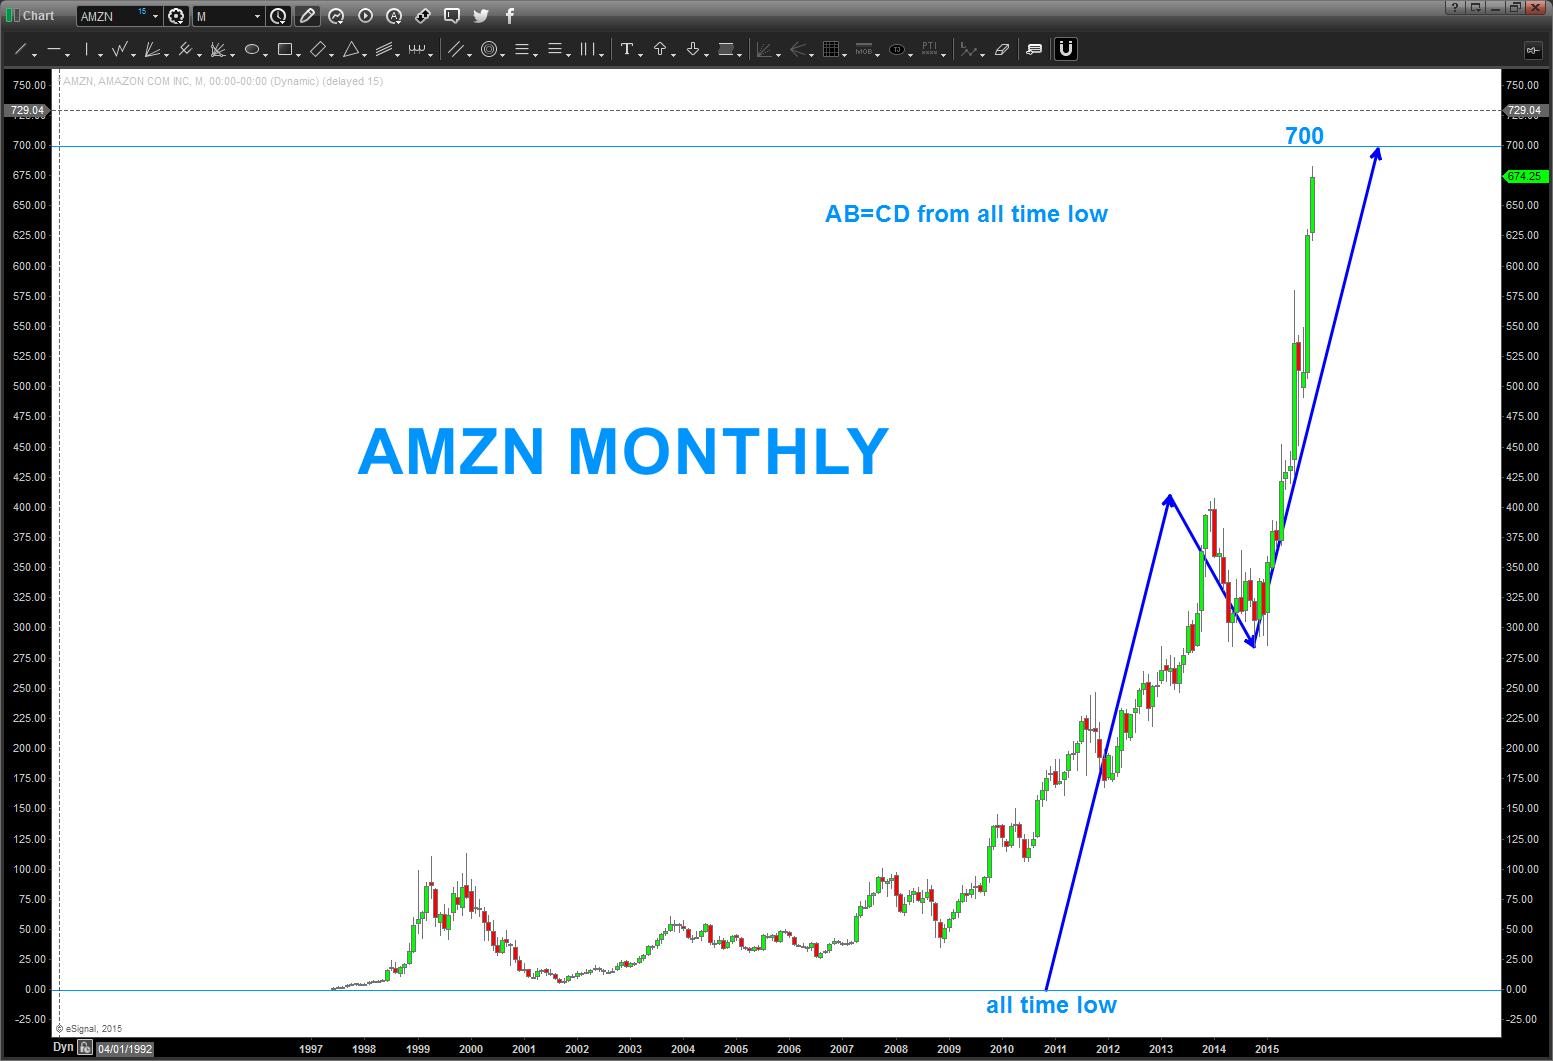
My conclusion: It’s been a great run by Amazon ($AMZN) and it’s a GREAT company. However, the parabolic nature of this run along with its extended RSI (monthly), bearish divergence on the weekly AND the AB=CD from the all time low begs of caution. Stay tuned… and remember, I was here on @seeitmarket warning of a coming top in Chipotle ($CMG) back in February. Same picture in $AMZN …that’s what I SEE not BELIEVE.
Thanks for reading.
Hope you had a wonderful Thanksgiving w/ family and friends.


