With Cyber Monday coming up, it’s a pretty huge time of the year for Amazon (AMZN – Quote). Interestingly, it’s also an important point in time for Amazon stock price. The coming weeks will likely determine the next big move in Amazon shares. Let’s dig in.
Since Amazon’s negative earnings reaction, the stock has been a beast, rising as much as 19% off the $284 low. The $340 area has been critical all year and it appears as if price may be stalling there again. The short-term trend for Amazon stock is still higher, but the intermediate term trend is still neutral. See chart below.
Amazon Stock – AMZN Daily Chart
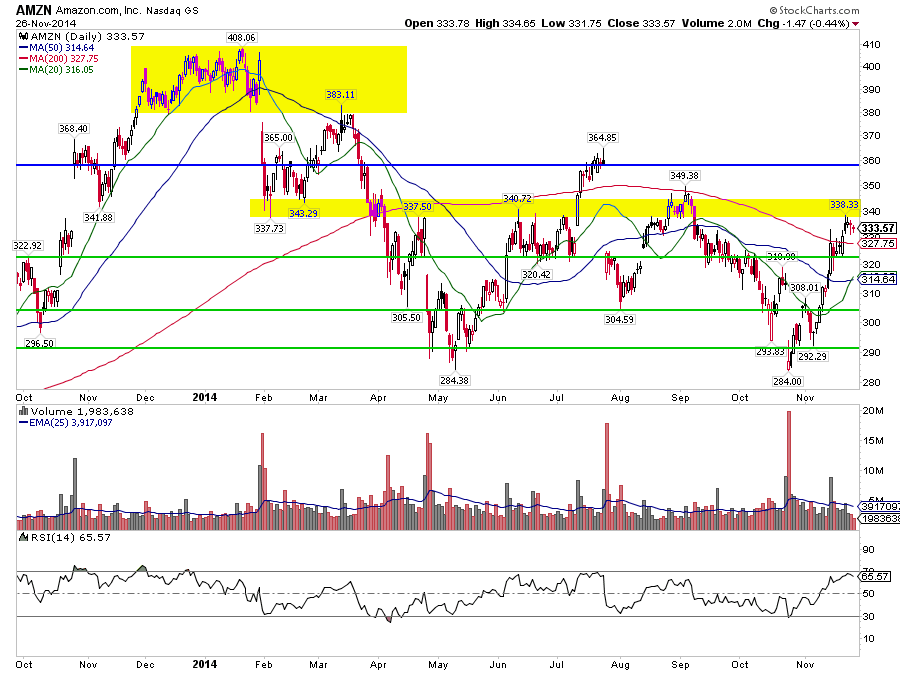
Upside upside levels worth noting:
- July earnings gap level near $360
- Last winter’s range low around $380.
Downside levels worth noting:
- Pivot areas at 320, 305 and 292ish
- The 2014 lows at 284
On the weekly chart we see what appears to be a falling wedge. No matter how you want to chalk up the downtrend, this area is significant.
Amazon Stock – AMZN Weekly Chart
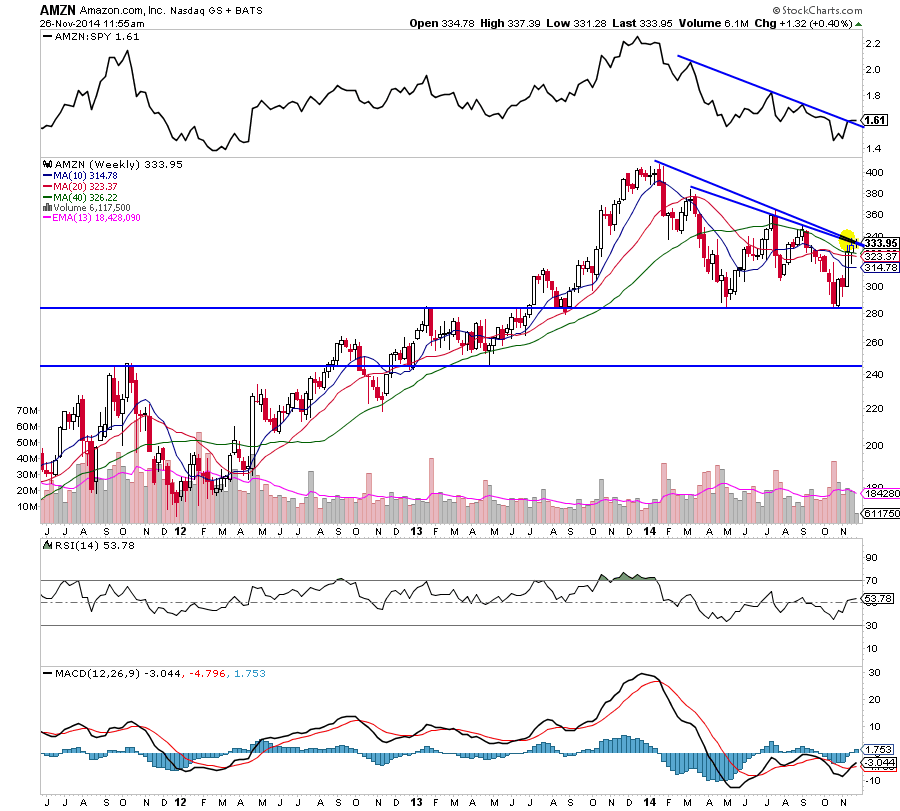
Amazon’s strength relative to the S&P 500 ETF (SPY – Quote) is showing some strength and starting to break an 8 month downtrend. At the same time, momentum via RSI is at the top of its nearly year-long range.
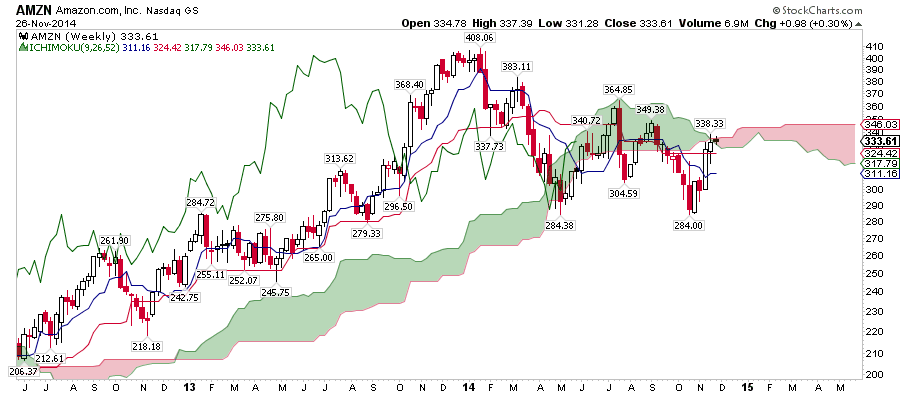
Let’s dig a little deeper and look at one more weekly chart of Amazon stock, focusing on the Ichimoku Clouds. Here we see the cloud is very narrow and actually flipping. We can conclude that the stock has found resistance, but more importantly this is a critical point in time for Amazon shares.
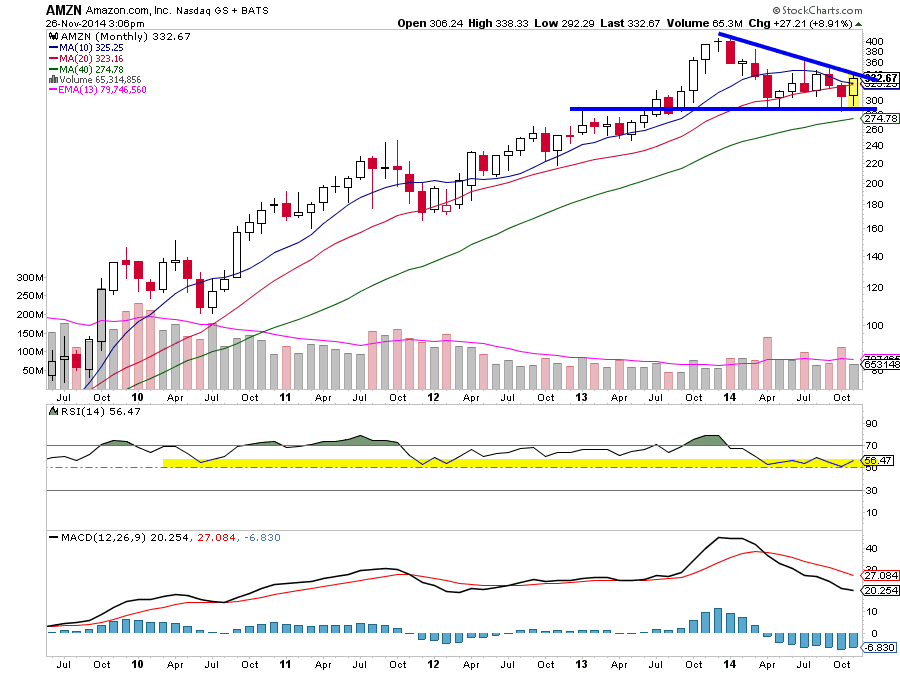
Zooming out to the monthly chart we see the $284 level has been a pivot before. The monthly moving averages are now essentially flat as price wedges. Note this elevated RSI level has been a floor for years now.
Amazon Stock – AMZN Monthly Chart
Do we have an edge here? It sure seems higher given the group’s tailwinds and momentum. At the same time, it’s really amazing how neutral the chart is across various timeframes. Our clearest take-away is the significance of both price and time here and now.
Thanks for reading!
Follow Aaron on Twitter: @ATMcharts
No position in any of the mentioned securities at the time of publication. Any opinions expressed herein are solely those of the author, and do not in any way represent the views or opinions of any other person or entity.


