While there are many that believe inflation is easing, there are still several that think it’s elevated.
Let’s just say it’s an uneven playing field with several categories up and other down.
One leading indicator to watch for inflation is the commodities sector. And today we look at a zoomed out long-term “weekly” chart of the Invesco DB Agriculture Fund ETF (DBA).
Besides inflation, the ETF is a tradable way to profit from moves higher or lower across the broad agricultural commodities sector.
Note that the following MarketSmith charts are built with Investors Business Daily’s product suite.
I am an Investors Business Daily (IBD) partner and promote the use of their products. The entire platform offers a good mix of tools, education, and technical and fundamental data.
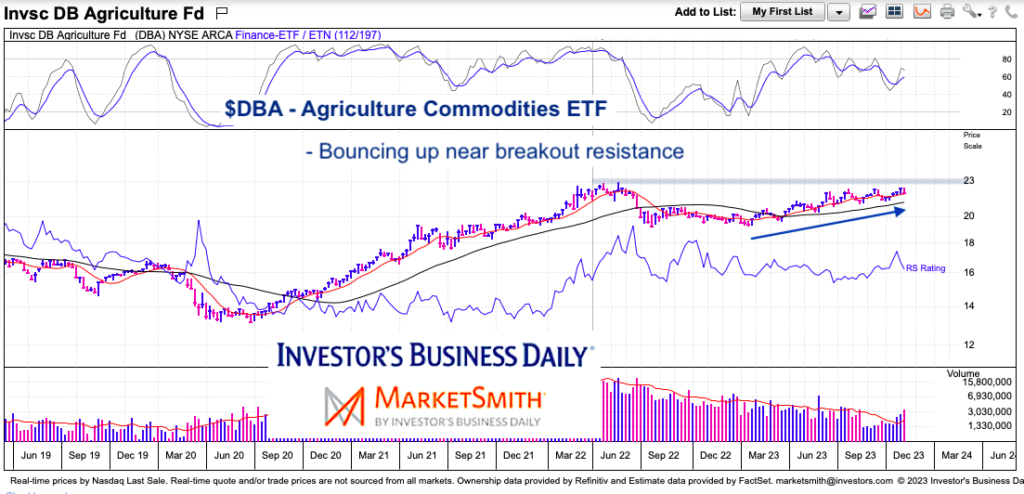
$DBA Invesco DB Agriculture Fund ETF “weekly” Chart
Taking a step back to look at a longer-term “weekly” chart can give you a better sense of the trend and price pattern formations. Here we see the 2022 highs, followed by a pullback, before another steady move higher. The pressure of the near-term uptrend (blue arrow) is about to meet the prior highs (blue shaded resistance).
There’s no guarantee of a breakout, but one should be aware that we are just a few percent away from that important test. Whether your are an active investor or watching for inflationary inputs, this is a sector to keep an eye on.
Twitter: @andrewnyquist
The author may have a position in mentioned securities at the time of publication. Any opinions expressed herein are solely those of the author, and do not in any way represent the views or opinions of any other person or entity.


: Showing Some Signs of Emerging Strength")
