Key Takeaways:
Even with the recent bounce, persistent selling over much of the fourth quarter leaves longer-term stock market trends in a challenging position. Fund flow data show evidence of panic selling in December, but optimism is already returning.
Emerging breadth thrusts suggest downside momentum is broken and have supported an upgrade in the overall weight of the evidence.
The S&P 500 has rallied more than 200 points (nearly 10%) from its Christmas Eve closing low, with half of the gain coming in a record-setting move on December 26.
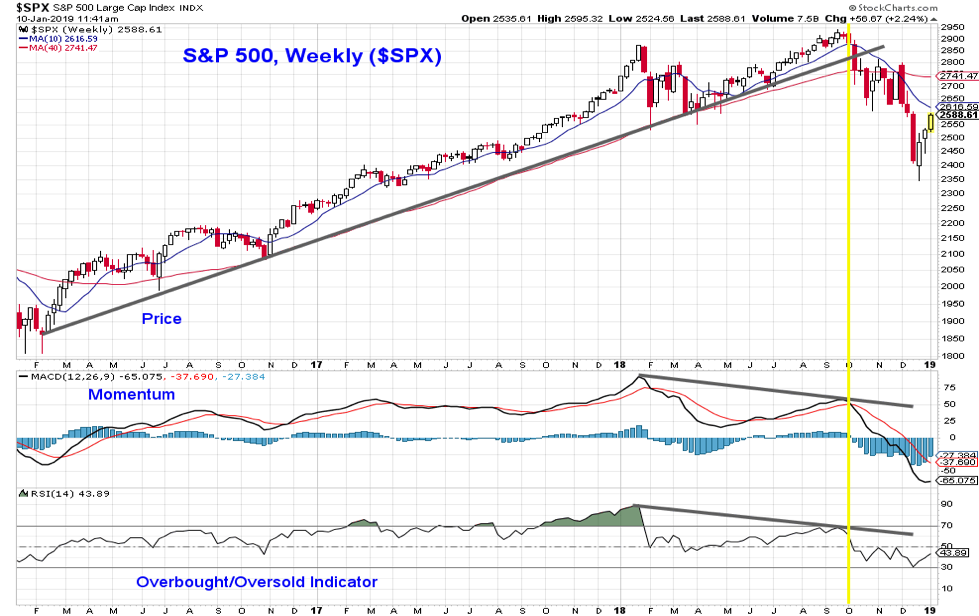
For all the volatility, the S&P 500 has only gotten back to its mid-December level. The deterioration in weekly trends that emerged over the course of the fourth quarter has not been meaningfully reversed.
The momentum trend remains lower and the overbought/oversold indicator remains in the bottom half of its range (below 50), consistent with an ongoing cyclical bear market. While there is evidence of near-term improvement in some breadth measures, they come within the context of weak long-term trends. A sustained up-turn in the weekly price and momentum trends may be necessary to get more constructive on stocks. Resistance on the S&P 500 is just ahead (above 2600), while support is near 2450 and again near 2400. Even with the recent breadth thrusts, some re-testing of recent levels would not be unexpected.
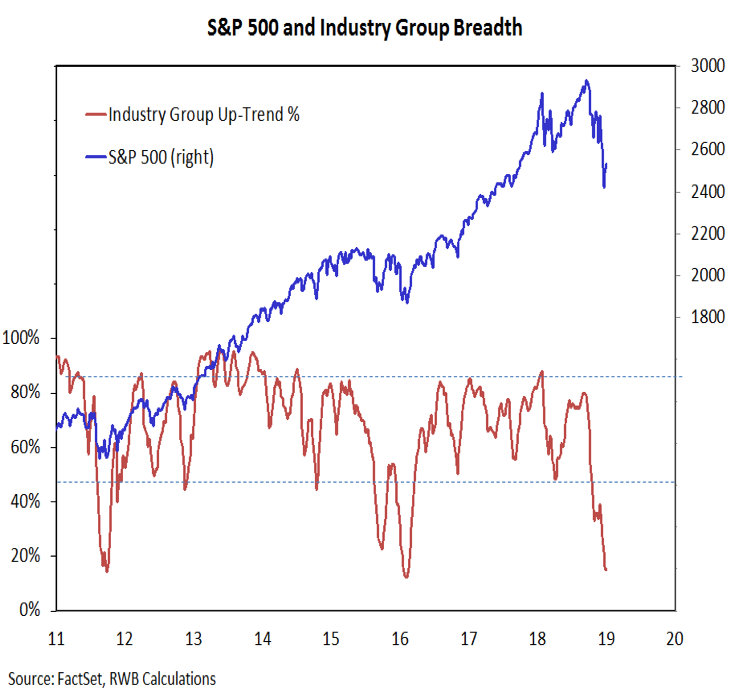
Our industry group trend indicator echoes the trend weakness shown on the weekly S&P 500 chart. The industry group up-trend indicator, which did not confirm the new summertime high on the S&P 500, deteriorated rapidly in the fourth quarter and has not provided confirmation of the bounce in the S&P 500 off its recent lows. Coming into this week, our industry group trend indicator (which is largely based on 10-week and 40-week averages) was at 15%, its lowest level since the February 2016 lows.
Amid the Q4 price weakness, there were numerous efforts to identify some degree of investor panic and capitulation. We were looking for pervasive pessimism on the weekly sentiment surveys to be followed by evidence that investors were indiscriminately selling. While not necessarily showing up where we were looking at the time, a look at equity fund flow data suggests there was some degree of panic. Over the past four weeks, investors have withdrawn nearly $100 billion from equity funds – this dwarfs previous extreme readings.
As stocks have stabilized more recently, investors have turned decidedly more optimistic. Keep an eye on fund flows to see if the December outflows are quickly reversed.
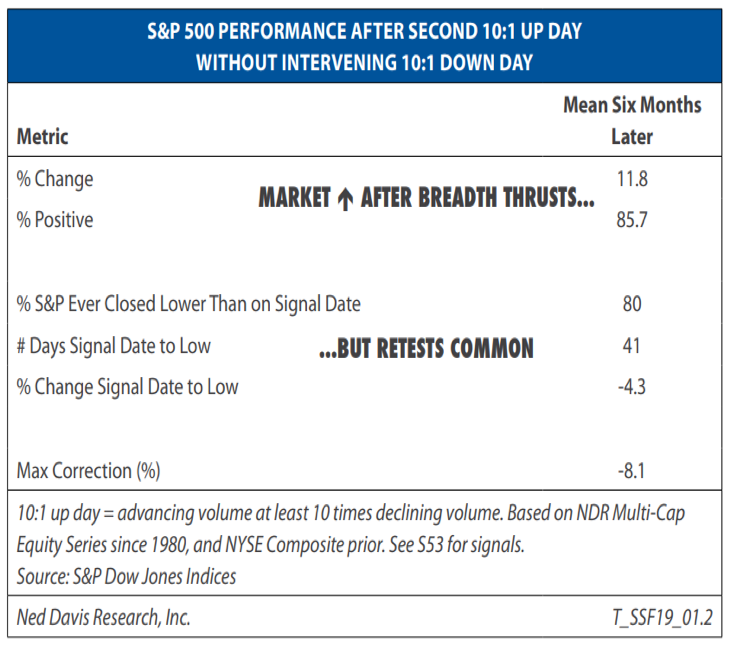
While industry group breadth trends remain challenging, the rally off of the Christmas Eve lows has been accompanied by multiple breadth thrusts. In last week’s Market Commentary, we expressed concern about the lack of near-term breadth improvement. The market appears to have picked up our challenge. The market appears to have picked up our challenge. We have seen a second 10:1 up-day (following the one seen on December 26), and this week brought more than 90% of stocks trading above their 10-day averages and the 10-day advance/decline ratio has exceeded 1.9. While these breadth thrusts do not preclude a testing of recent lows, they do suggest that downside momentum has been broken. This supports the upgrade in our overall look at the Weight of the Evidence.
Breadth thrusts, almost by definition, result in the stock market being overbought on a short-term basis. As such, it is not uncommon to see some near-term weakness immediately after breadth thrusts emerge. But they also signal a change in tone beneath the surface and point to improving market conditions moving forward. Stocks have been positive in the six months following a second 10:1 up day in 86% of the cases, even though in 80% of the cases the stocks re-tested their lows (with an average post-signal pullback of 4%). The track record following spikes in the 10-day advance/decline ratio is also impressive. Despite a more mixed reaction in the immediate wake of such signals, in only one of 48 cases have stocks been lower a year later. This week saw the first signal from this indicator since late 2016.
Twitter: @WillieDelwiche
Any opinions expressed herein are solely those of the author, and do not in any way represent the views or opinions of any other person or entity.


