This post was written with Craig Basinger of Richardson GMP.
It was the best of times, it was the worst of times – Charles Dickens penned so many years ago.
Well, for active managers this appears to be the worst of times based on the S&P SPIVA reports and fund flows. For all U.S. domestic equity funds, 92.9% have been outperformed by the index over the past three-year period. Suppose the good news is, with only 7% of funds winning, this can’t get much worse. Canadian managers have fared better, but not by enough. With only 17% of Canadian equity managers outperforming the TSX in 2016, the three- year period has dropped to only 19% outperforming. Pouring some salt on the wound, U.S. equity funds have seen substantial net redemptions over the past few years while equity ETFs have seen sizeable, albeit sporadic, inflows (1st chart). According to Barron’s, investors pulled $574 billion from active funds over the past two years and plowed $924 billion into passive funds.
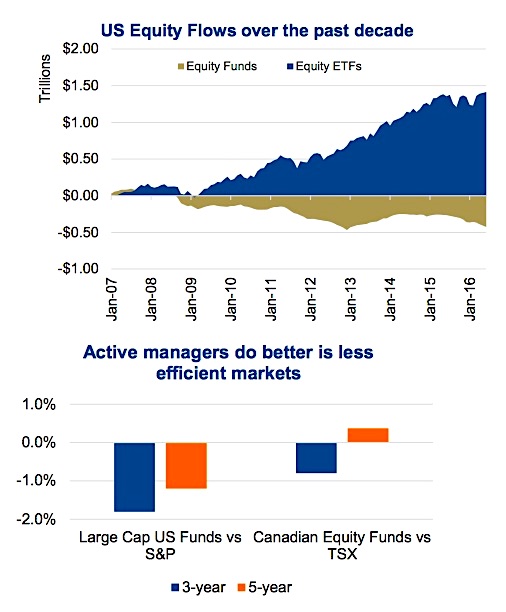
Since 2010, this has been a tough environment for active managers. In each calendar year, less than half of the large cap U.S. managers outperformed the S&P 500 Index (INDEXSP:.INX). And in 2011 and 2014, only 18% and 13% outperformed. Yikes!
The last two years have been better, with roughly one third outperforming the index. As we mentioned, Canadian managers have had greater success, but last year didn’t help. Materials and Energy were the best performing sectors during that period in Canada, which contain more companies that are smaller and riskier. As a result, we would be weary of any manager that did outperform the TSX last year. Or at the very least dig in to see how they outperformed and how much risk was taken.
Even with a soft showing for Canadian managers in 2016, it still does appear easier to outperform the TSX compared to the S&P 500. The 2nd chart above compares the asset weighted returns for U.S. managers vs. the S&P 500 over the past three and five years. Plus the same comparison for Canadian managers against the TSX. While the Canadian edge over our U.S. counterparts has narrowed, Canadian managers are still enjoying greater success.
When to be Active, When to be Passive
Notwithstanding the great run passive investing has enjoyed over the past half-decade, we believe there are two critical factors that determine which investment style has the upper hand. But before we discuss these, our underlying contention is that neither strategy is necessarily superior. Markets change too fast and evolve too quickly. A great example of change is given the rise in assets in passive ETFs, it is now estimated that over one third of trading volumes are driven by ETF market makers executing baskets. The basket is based on the index of the ETF that is seeing either in or out flows. This is rather indiscriminate buying or selling. Active managers have changed too. Fees have been coming down, reducing the cost gap with ETFs. Still, with many active managers not far enough away from the index, many continue to be replaced by an ETF. The only constant in the markets is change.
Index Construction – As passive investing follows a given index, how that index is constructed becomes of critical importance. Some indices are better balanced and some are not. We believe those that are not well balanced or constructed are easier for active managers to outperform or add value by reducing risk.
The vast majority of indices are market capitalization weighted, meaning bigger cap companies carry bigger weights. But they are also constructed based on the companies trading on an exchange(s) or in a specific country. The index simply becomes the residual of the companies trading in a country. This creates distortions when compared to the economy. Consumer stocks represent 10% of the TSX but a far greater portion of the economy. It can be distorted by a few mega companies. Nortel did this to the TSX years ago. Valeant rose to over 5% of the TSX, yet it was largely a U.S. company. Today it is safely below 1%, but the lesson remains.
Smart beta or factor based ETFs have been rising in popularity, call them something in between active and passive. Selecting a few factors, these ETFs provide a different exposure relative to a simple market cap based indices. However, they also create other risks. The top chart below is the sector weights of the largest dividend focused ETF in Canada. dfEveryone likes dividends, but 57% Financials with 0% in Consumer Staples, Health Care and Technology does not make for a well diversified portfolio.
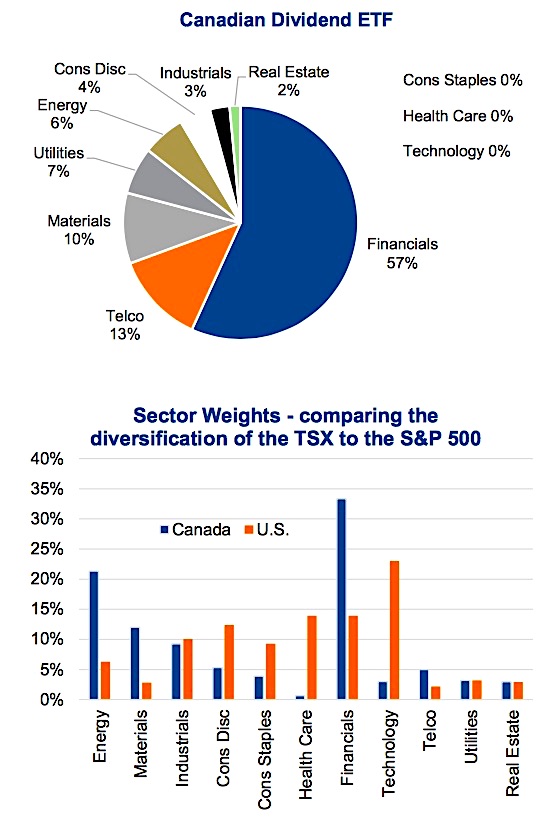
Some indices are better balanced or constructed than others. Those that are poorly diversified should be easier to outperform using active management. Or at the very least, should be easier to better diversify the embedded risks built into the index. From our experience, the TSX is easier to outperform than the S&P 500, which is arguably better diversified. The 2nd chart contrasts sector weights between the U.S. (S&P 500) and Canada (TSX). As you can see, there are a few sectors extremely lacking in Canada and a couple that have extra big weights. The U.S. at the very least appears more balanced.
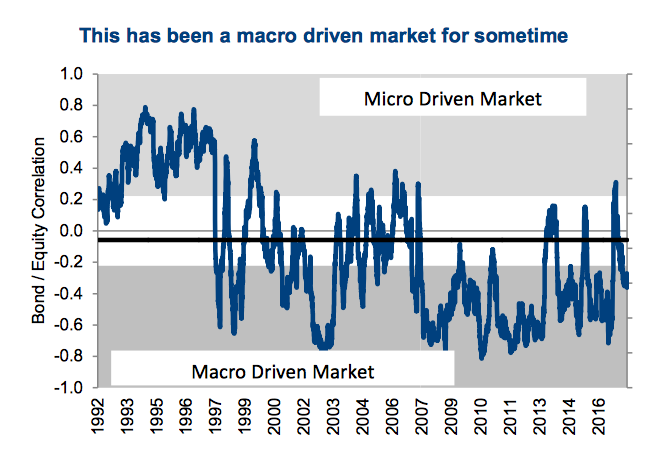
Market Environment – This is a big driver and we believe it has a more dramatic impact on the relative performance or success of active vs. passive. And it tends to be cyclical. We believe there are two kinds of markets, macro driven and micro driven. Macro driven markets are those where big data points, such as central bank policy, economic data or other broad reaching forces are the bigger driver of performance. Conversely, micro driven markets tend to have individual company or fundamental data as the bigger driver of performance.
To say this has been a macro driven market is an understatement. The amount of quantitative easing and central bank policies have impacted all asset prices. The chart below shows one of our measurements of macro vs. micro markets and this one has been a macro most of the time since 2007. Macro markets depress stock disparity and cause individual stock performance to be more correlated to the overall market. Active managers need stock disparity to succeed.
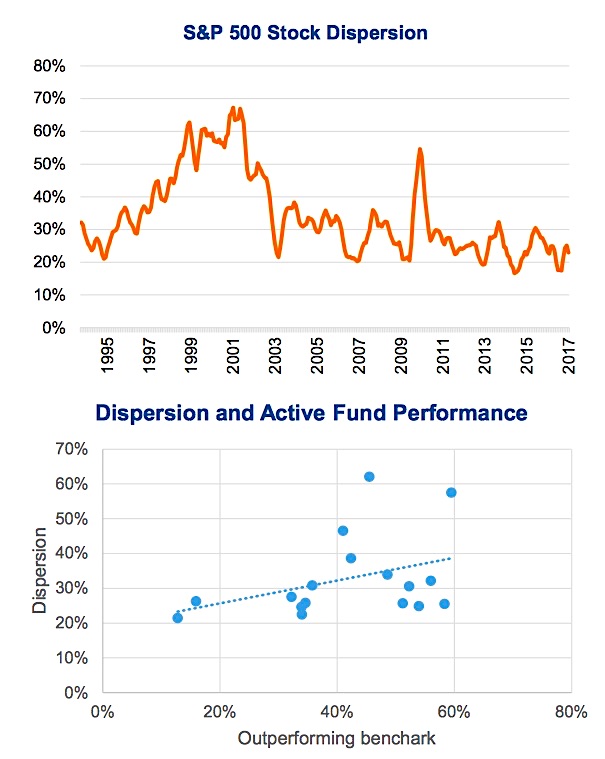
Stock disparity (top chart below) as measured by individual stock performance relative to the performance of the S&P 500 has certainly been depressed for the past decade. With less disparity, it is simply harder to find the winners and even if you manage to create a portfolio with more winners, the amount they win by is lower. And for an active manager who needs to overcome a fee hurdle, disparity is key. The lower chart below is the calendar years contrasting disparity with the percentage of U.S. managers beating the index. When disparity is low, fewer outperform than when disparity is higher.
Investment Implications
The investing landscape has certainly changed with the rise in popularity of passive investing, now mainly done via exchange traded funds (ETFs). This rise in popularity and assets invested in a passive nature may also be a self-fulfilling influence on the market. Given change is the only constant in the market, what could change this environment? Well, quantitative easing does appear to be on the decline and some central bank tightening may lead to greater disparity. This may tilt the balance back to active, but at this point it may be too early to dump those cheap ETFs for active managers.
Instead we suggest investors utilize a more balanced approach. In more efficient and well diversified markets, lean more towards passive investment strategies such as ETFs. In less efficient markets that are not as well diversified, use more active managers that can better control risk and exposures within the portfolio. The answer is not binary when it comes to active vs passive, we believe diversification across both remains best.
Thanks for reading.
Charts are sourced to Bloomberg, ICI and S&P unless otherwise noted.
Twitter: @sobata416 @ConnectedWealth
Any opinions expressed herein are solely those of the authors, and do not in any way represent the views or opinions of any other person or entity.


