 Over the past couple of months, I have written posts on Apple (AAPL) and its unfolding technical setup. From a potential double bottom formation to the recent AAPL breakout, I’ve tried to highlight key AAPL support and resistance trading levels, where applicable. And considering AAPL just reached my prior resistance target (.382 Fibonacci retracement and January breakdown around $510), it’s a good time for a chart update.
Sure enough, Apple found turbulence as it crossed $500. After a grind to $510, it reached up as high as $514 before turning lower. So now what? Let’s look at some AAPL support and resistance levels (and potential magnets).
On the support side, August 15 provides a couple of clues. First, the close produced a back-to-back cluster at $497/$498. And second, the daily price bar left a tail as low as $489 before reversing higher into that close. Traders don’t like to see reversal tails taken out. So if that is lost, we may see a retest of the pre-breakout highs around $470 and possibly as low as the original .236 Fib. In summary, support $497, $489, and $470.
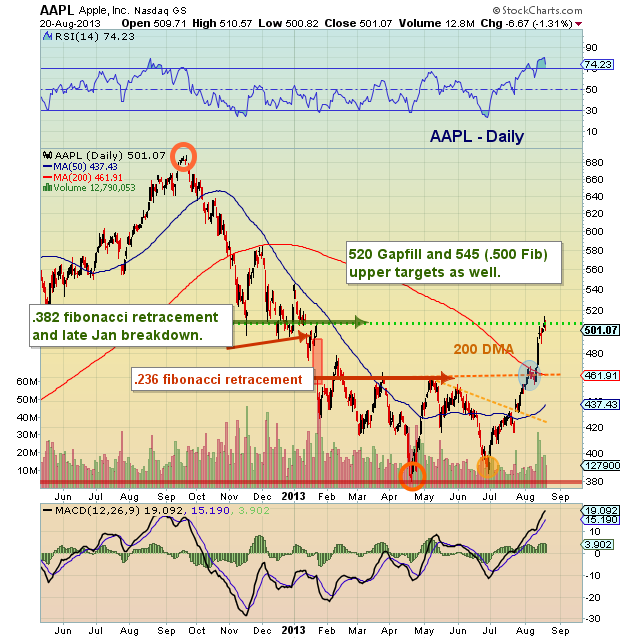
If AAPL can break above its recent highs (now resistance), it will likely have eyes for $520 (Jan 11 gap-fill). Above that comes $545 and $582, the .500 and .618 Fibonacci retracement levels, respectively.
Trade safe, trade disciplined.
AAPL Support and Resistance Stock Chart – August 2013
Twitter: @andrewnyquist and @seeitmarket
No position in any of the mentioned securities at the time of publication.
Any opinions expressed herein are solely those of the author, and do not in any way represent the views or opinions of any other person or entity.


