 Let’s take a quick look at some macro AAPL technical support levels. As Apple’s (AAPL) stock price holds just above its recent lows, many investors are pondering two very distinct technical scenarios: 1) a double bottom 2) another whoosh to new lows. Note this was all brought into focus after AAPL failed to break above key resistance at $465-$470.
Note that AAPL is still bearish until proven otherwise and that, although broken stocks are fun to watch and speculate about, they offer better risk/reward after price firms and offers a retest (stops please!).
AAPL technical support: So is that happening now? AAPL is retesting its recent price lows (from April) and offering up a potential double bottom on the charts (or undercut of the lows). But this is tenuous at best, so don’t forget to bring your stop-losses to work if interested.
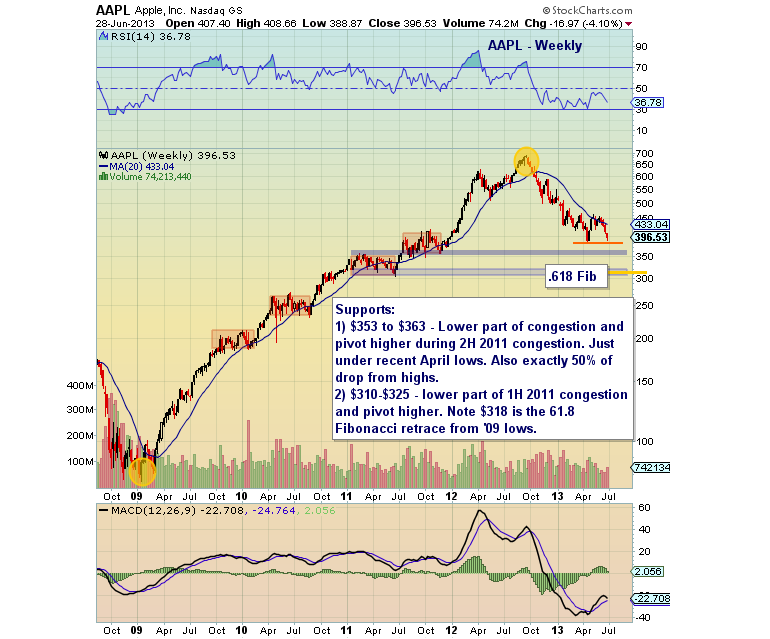
Should near-term AAPL technical support break down, AAPL may be in for another whoosh. Loose support resides between $353-$363, with stronger support between $310-$325. Note $318 is the .618 Fibonacci retracement of the 2009-2012 move higher.
Trade safe, trade disciplined. See chart below.
AAPL Technical Support Weekly Chart
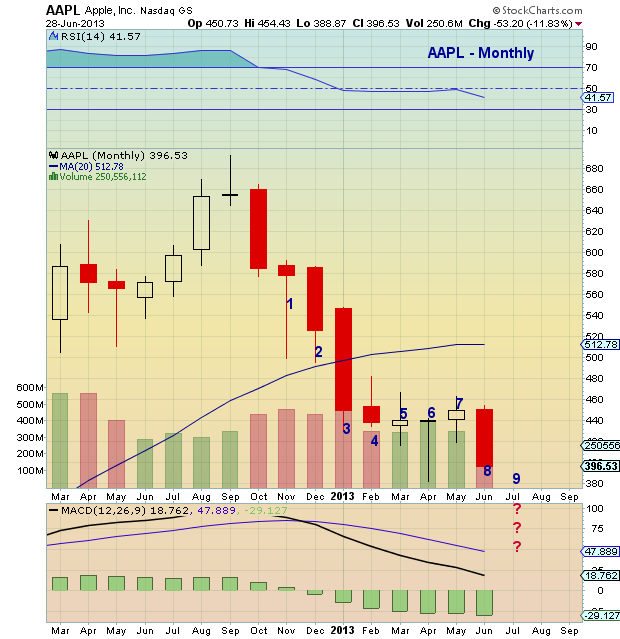
Lastly, on the monthly chart, AAPL will begin bar 9 of a 9 buy setup. BUT it needs to finish out bar 9 in July, and this could bring new lows. Note that new lows would “perfect” the setup (although they are unnecessary for it to record).
AAPL Monthly Stock Chart
Trade safe, trade disciplined.
Twitter: @andrewnyquist and @seeitmarket
No position in any of the mentioned securities at the time of publication.


