We’ve been tracking Apple ($AAPL) since February 2015. At the time, I shared some ending price targets for the major wave it was in. And as the wave reached up toward the target, I warned readers of See It Market that Apple (AAPL) was nearing a top.
And after the initial sell off, we updated potential price targets. Apple has since sold off nicely and it’s time to look at an AAPL buy setup.
This is the fun part, since so many folks are either invested in Apple stock (AAPL), or want to be. And since the market is finally getting bearish on the stock, guess what? We have a beautiful AAPL buy setup emerging.
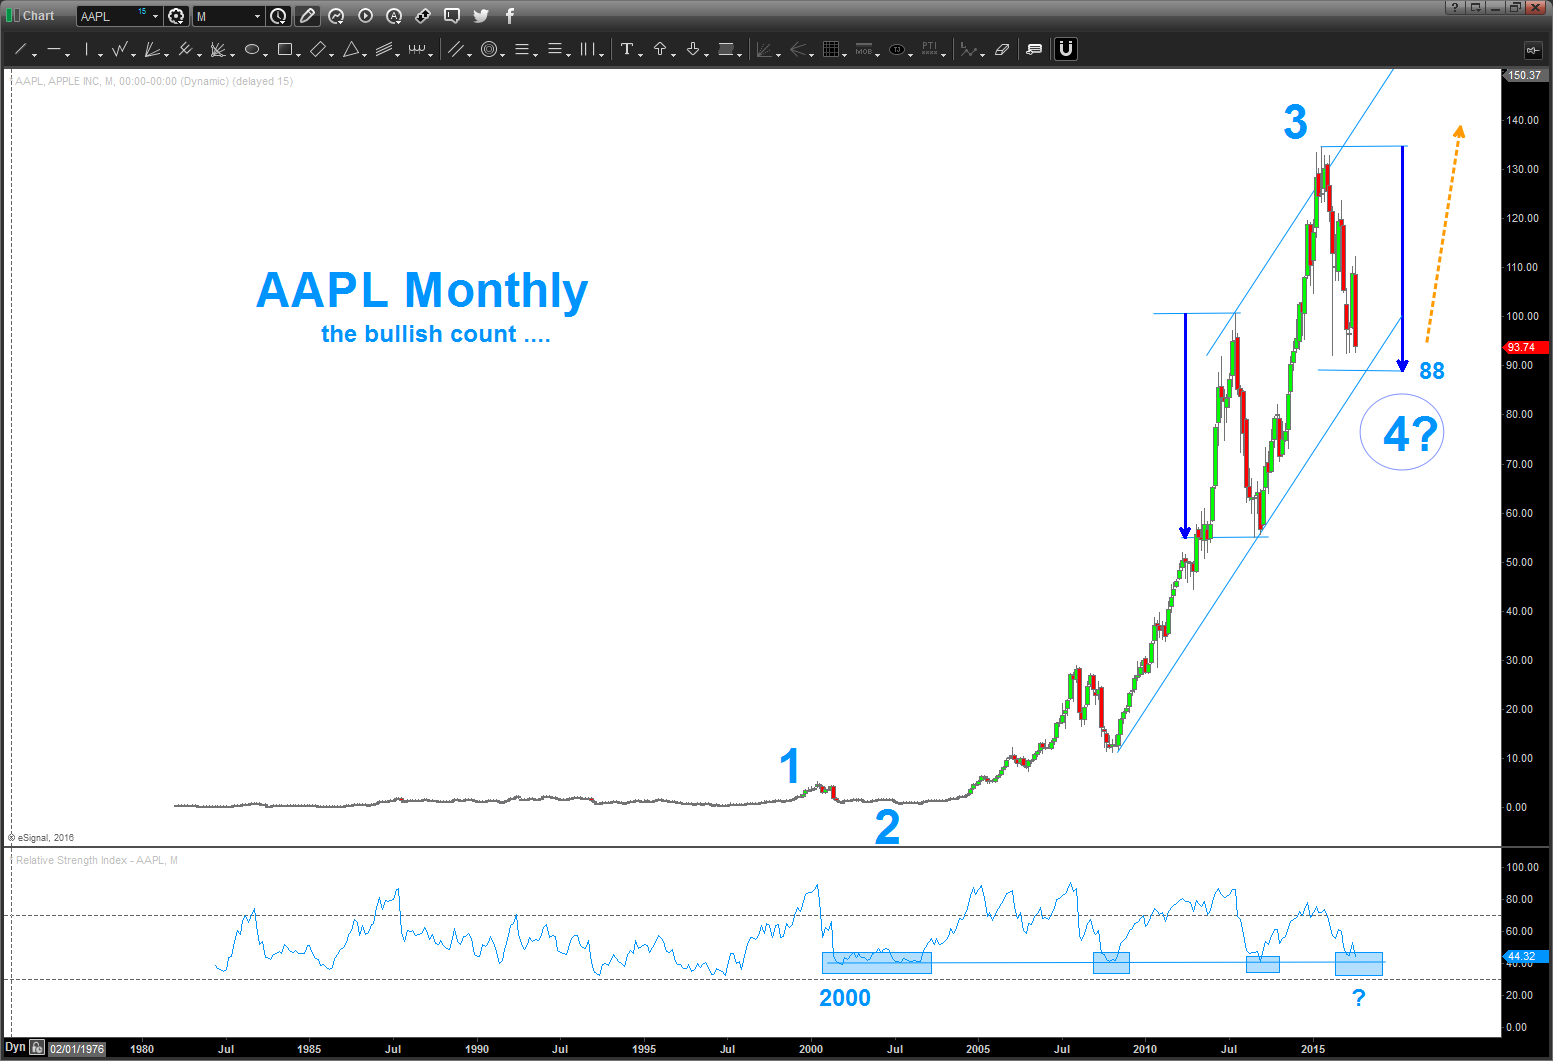
If the “count” is correct then this could possibly be a low in AAPL w/ another run up to new highs. This is such a nice pattern that if it fails, it really doesn’t bode well for AAPL over the long term.
Additionally, the current level of support at 92 is a PERFECT square root target.
- Square Root Math:
- 67 square root = 11.60
- 60-2 = 9.60
- 60^2= 92.16
This is the reason 92 is holding.
But this level looks like it may break. So let’s look at the monthly, weekly, and daily chart patterns to hone in on a price target band for this AAPL buy setup.
In the first chart below, note the RSI levels. We’re approaching current levels that started every BULL move in AAPL. Additionally, were about to challenge the lower trend line right around the size of the last measured move correction. If we are bullish, these levels should hold.
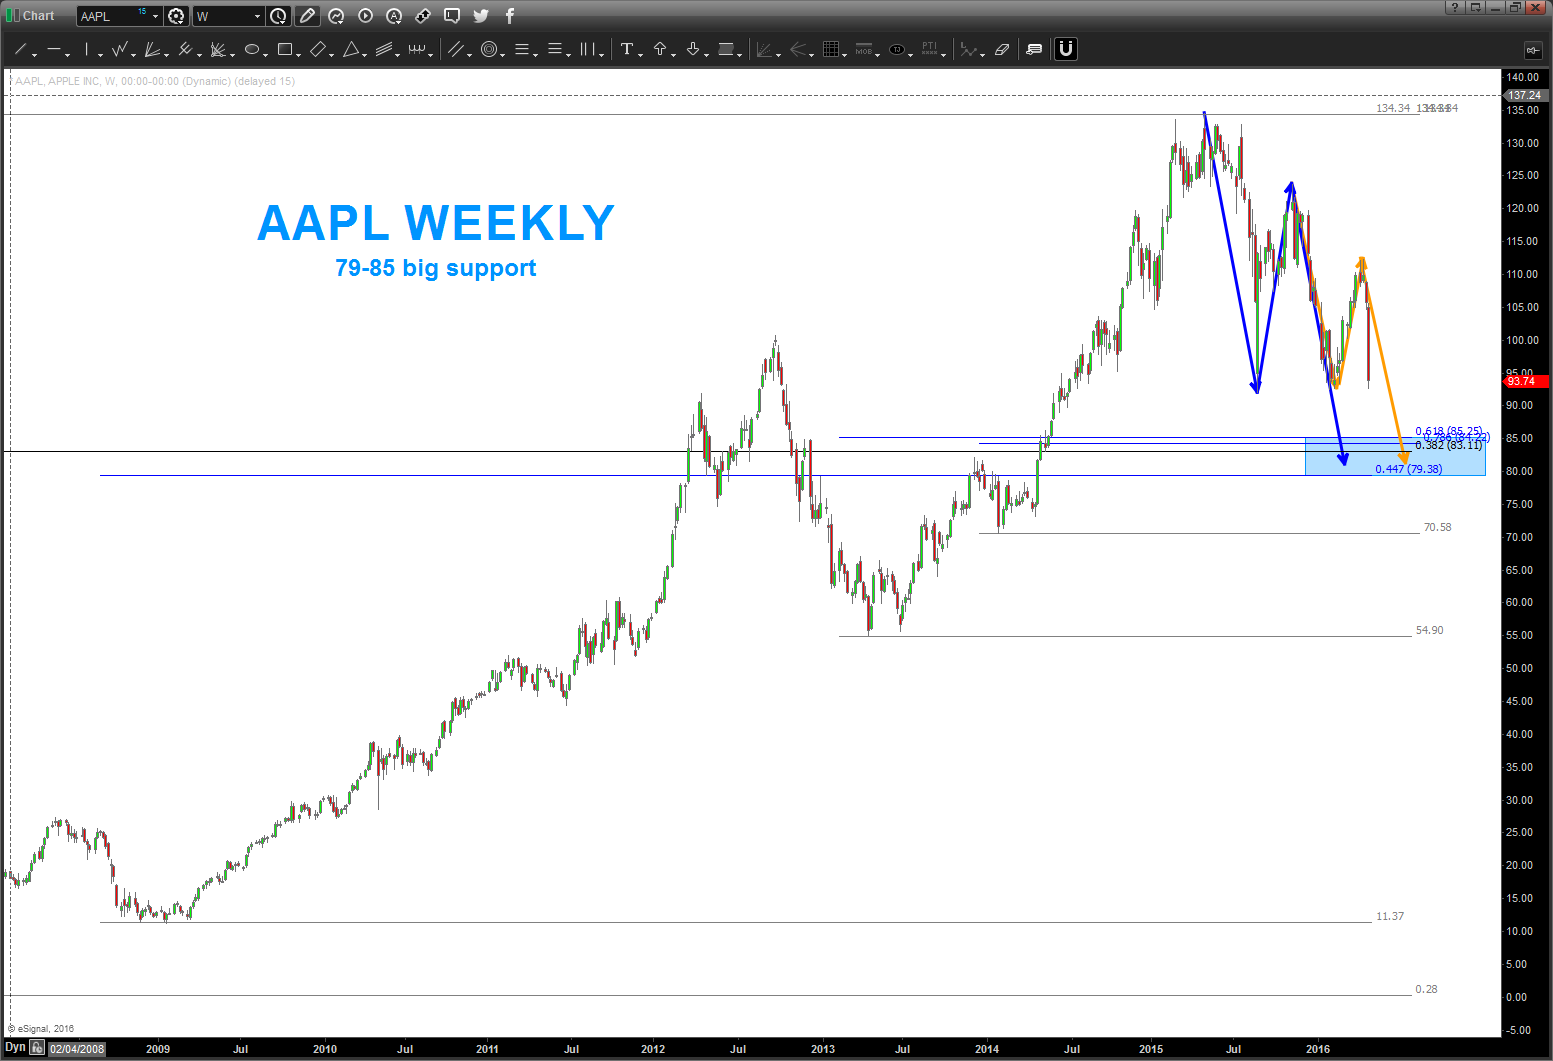
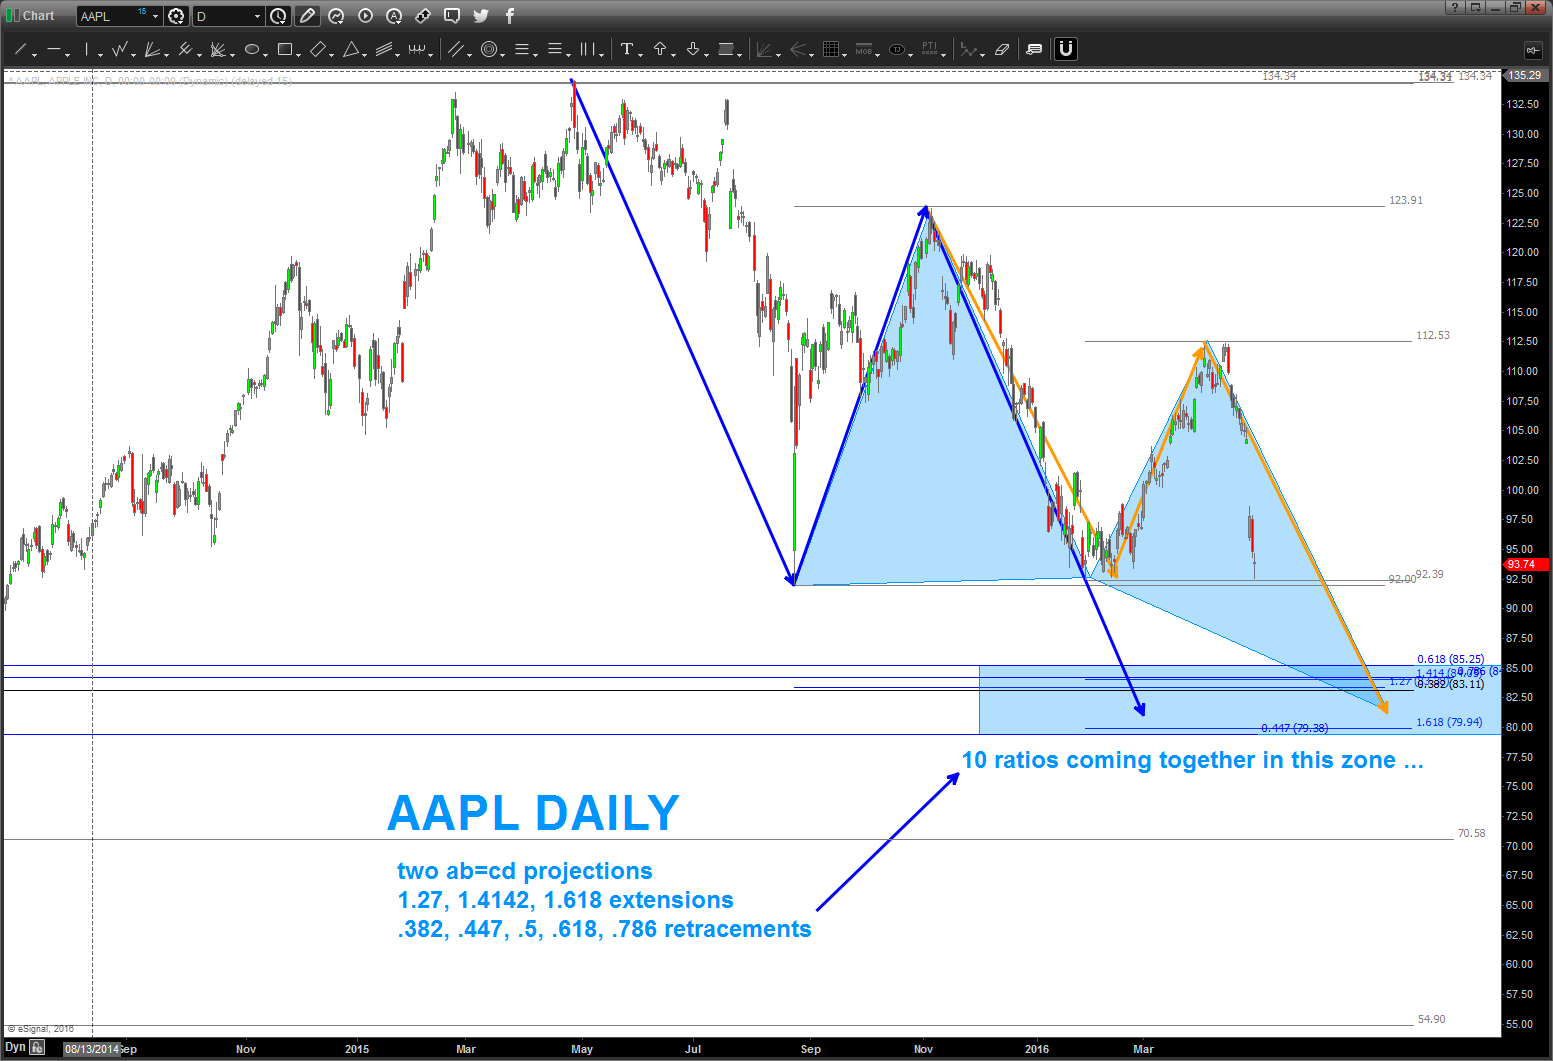
The next chart is showing a confluence of price targets for this AAPL buy setup and why they are so important. Note the two ab=cd projection targets coming together almost perfect at the .382 retracement from the all time low in AAPL node. This should be strong support.
When we zoon into the daily we can add some nice extension price targets and all of a sudden we have 10 ratio’s all coming together with in the 80-85 zone. Folks, it doesn’t get any better than that.
So, in the conclusion, IF the count is right THEN this level should be a catalyst to propel AAPL higher. Again, as a pattern recognition trader I would assume any weekly close below 78-79 would make the bulls really question owning this stock. That’s the under side of the AAPL buy setup. If Apple loses this level to the downside then we’ll ‘ctrl-alt-del’ and look for another level lower. FYI, any rally that starts will have to play against the formidable resistance at 92 (polarity). If we can get up thru that then it should be off and running.
Thanks for reading and make it a great week.
More from Bart: Amazon Stock Chart Update: Retracing The Decline
Twitter: @BartsCharts
Author does not have a position in mentioned securities at the time of publication. Any opinions expressed herein are solely those of the author, and do not in any way represent the views or opinions of any other person or entity.


