This week’s “One Chart” is the S&P 500 Index using the AAII rankings, which is a survey from the American Association of Individual Investors where they ask people whether they’re bullish, bearish or neutral on stocks for the next six months.
This comes out every Thursday afternoon and today, the results were pretty dramatic.
Last week we had a nearly even number of bulls and bears (30-40% bullish and 40% bearish).
This week took a dramatic turn and now there are 22% more bears than bulls.
S&P 500 Index with AAII Survey Indicators
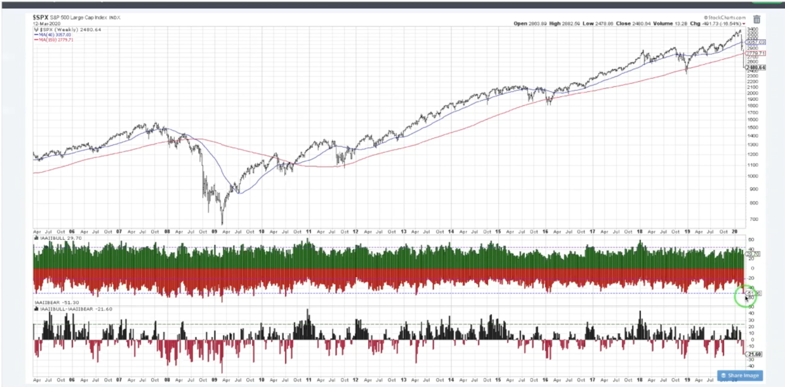
If you look at the chart, 30% of respondents said they were bullish on stocks, and over 50% of respondents said they were bearish. This is obviously with the market on its third big distribution week, coming this week.
So what does this mean?
Well, if you look back to the left on the chart (which is going back 15 years to get a good amount of history), it is actually very rare that this bearish rating has been over 50% – that is, where over half of the respondents said they were bearish on stocks.
The most recent time this happened was in the December 2018 market low when we just touched that 50% level. Before that, you actually have to go back to 2016 where we just barely got there (not quite, but let’s count it for the purpose of this discussion), then before that, we’re looking at 2013 and 2011.
The reason why this is very rare is because I think a lot of investors are getting caught up in “short term-ism”. If you look at a chart for the last couple of years, you see that this bearish rating is so severely negative, you think, “okay, this lines up with previous market bottoms as in 2018 and 2016.”
My argument is that we are now facing a very different regime. This is not just a garden-variety pullback within a secular bull market, I think this instead is a dramatic shift in sentiment overall. This is more of a paradigm shift, from a bullish phase to overall more of a bearish phase, which will take a lot more backing and filling than what we have experienced so far.
What I would also point out is if you go back to 2007-2008, and 2009, this is when the market again rotated from a cyclical bull market to a cyclical bear market.
It rotated lower and you can see how often over half of the respondents were bearish. From the 2007 high to the eventual low in 2009 this happened pretty regularly. A few times a quarter this would go below the 50% level and often remain there for weeks and weeks at a time.
My illustration of this serves two purposes. First, I want to caution you to not be too short-term that you forget the long-term perspective. Secondly, I want you to start to look at what we’re seeing now from a breadth perspective- what we saw back in 2008-2009 with some of those historical cyclical bear market phases, I would argue this is more of the environment we are facing now.
To watch this in video format, just head over to my YouTube channel!
Twitter: @DKellerCMT
The author does not have a position in mentioned securities at the time of publication. Any opinions expressed herein are solely those of the author, and do not in any way represent the views or opinions of any other person or entity.

: Showing Some Signs of Emerging Strength")

