Gold prices have chopped higher since bottoming in December 2015.
The move has not been as exciting as precious metals bulls would like but its followed a trend of higher lows nonetheless.
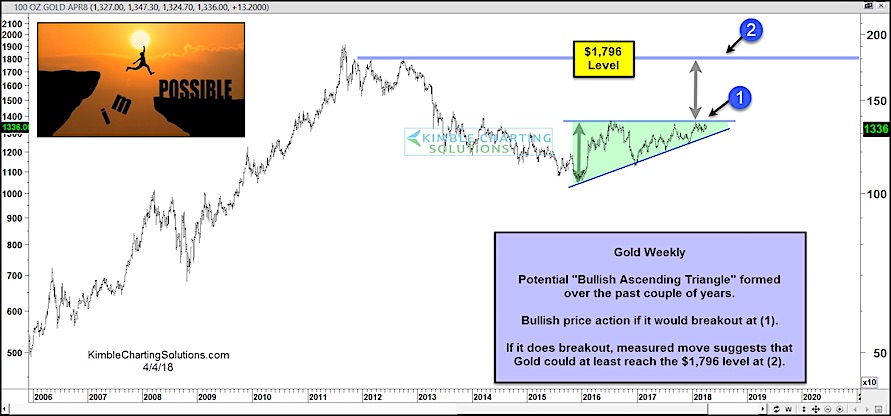
During the same time frame, Gold has tested the $1360 – $1375 price level on multiple occasions – see resistance line at (1). This action has created a compression pattern that is creating pressure to the upside.
This pattern is known as an ascending triangle and would be very bullish for gold IF prices can breakout ABOVE current resistance at $1375.
If gold does break out to the upside, a measured move price objective of $1796 could be reached – see line at (2).
This setup requires patience as Gold is still trading under $1375. Note that a move lower that breaks the uptrend line (around $1275) would negate this pattern.
Gold “Weekly” Chart
Note that KimbleCharting is offering a 30 day Free trial to See It Market readers. Just send me an email to services@kimblechartingsolutions.com for details to get set up.
Twitter: @KimbleCharting
Any opinions expressed herein are solely those of the author, and do not in any way represent the views or opinions of any other person or entity.


