Looking at key stock market ETFs that comprise our Modern Economic Family shows a unique market vantage point.
The Modern Family has continued to serve as a reliable indicator for stock market direction through the years.
This composite of stock market ETFs gives you an overall gauge of how aggressive or conservative you can be in your trading strategy. Today, the Modern Economic Family of ETFs tells us we need to stay alert.
All of these ETFs, except semis and biotech, are underperforming relative to the S&P 500 benchmark, a clear risk-off indication.
Our proprietary Real Motion Indicator above shows that IWM’s downward momentum is in line with the price. In other words, we could see further selling pressure.
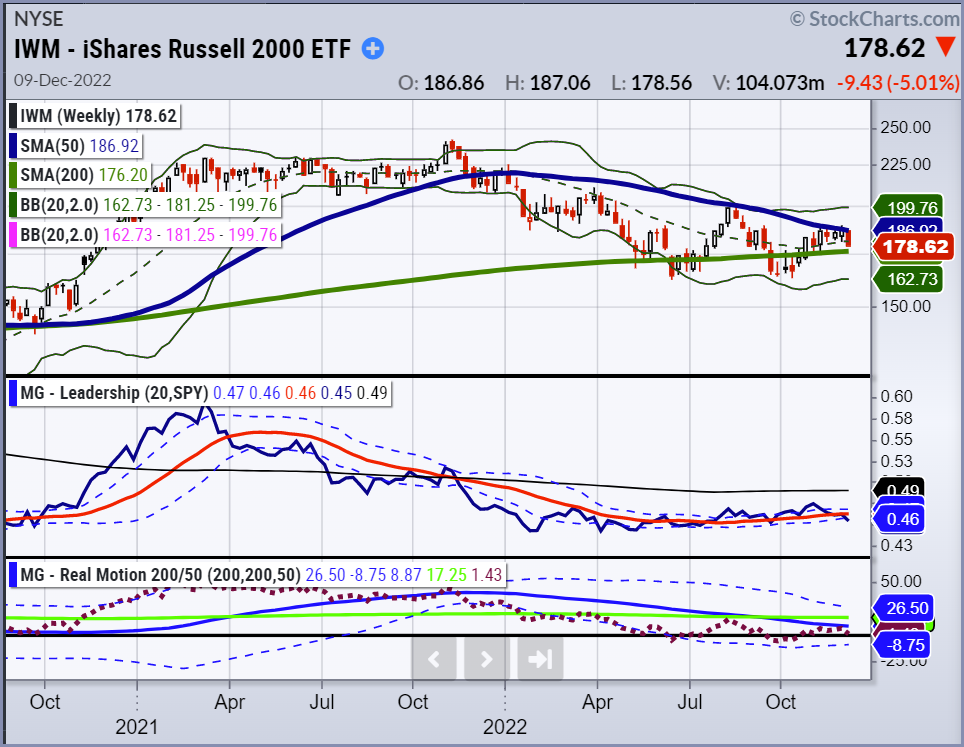
The Russell 2000 ETF (IWM) could fall below his 200-week moving average. If IWM breaks current support, this will signal to reduce some high beta exposure and raise stops.
And the Semiconductors ETF (SMH) shown below has been a recent leader as seen in our Leadership & Triple Play indicator. SMH is down -30.3% year to date but up 12.1% over the last month.
SMH is the largest semiconductor ETF with international exposure.
It has overhead resistance on the daily and weekly charts.
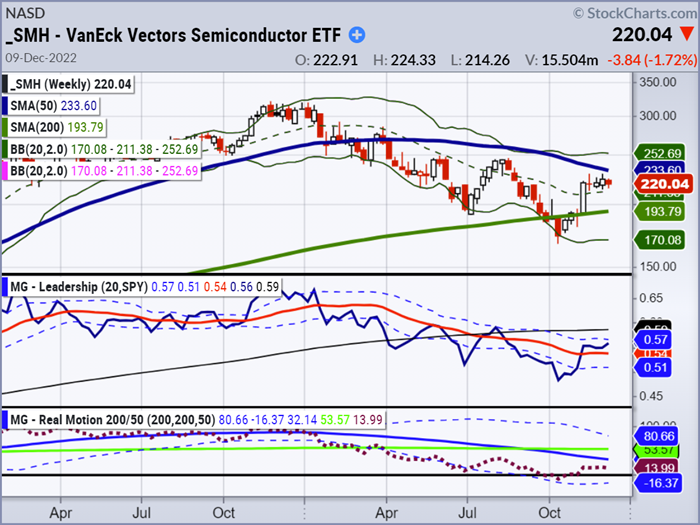
The daily chart is not displayed, but the 200-day moving average is 224, so only slightly above the 220.04 weekly closing price. SMH shows the 200-week moving average at a higher resistance level of 233.
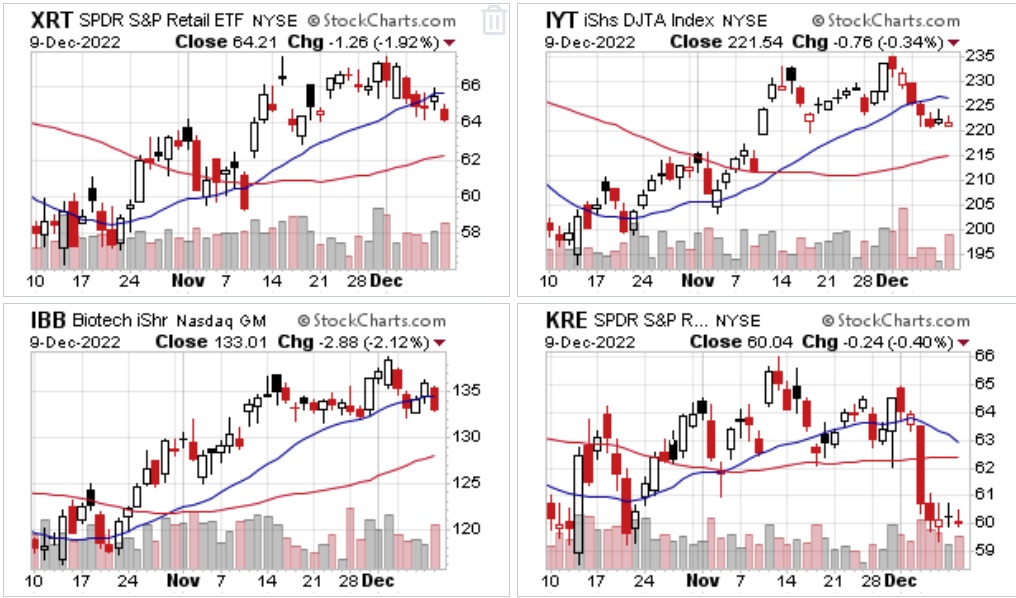
IBB is above the 50-day, 200-day, 50-week, and 200-week moving averages, placing it as the strongest member of the family.
The transportation sector (IYT) regional banks (KRE) and Granny retail (XRT) are losing momentum, which is terrible for the economy and the stock market.
Next week is one of the most event-driven weeks of the year, with CPI, FOMC, and the Triple Witching Hour quarterly expirations. The November CPI inflation report comes out on Tuesday, Dec. 13, with the year-end Fed rate hike and the Powell news conference on Wednesday.
Keep an eye on KRE, XRT, IYT, IWM, IBB, and SMH as we move into next week and the holiday season.
All family members are breaking down, and only (IBB) and (SMH) look to have continued technical strength.
Following the leaders and decliners will give us a good indication of risk-on or risk-off indicators as Wall Street wrestles with fears about inflation and an impending recession.
As always, there are other factors to consider when making trading decisions but following the Modern Family members can help you stay informed.
So far, this holiday season, Santa may be coming to town. Keep your eyes on these family members to make sure Humbug doesn’t take control.
Stock Market ETFs Trading Analysis & Summary:
S&P 500 (SPY) 390 first level of support and 397 resistance. The 50-week MA looms above as overhead resistance 410. Until that clears, this could return to support at the 50-DMA or 380.
Russell 2000 (IWM) 176 key support and 182 resistance. Similarly, 190 is resistance and now looking at 177 as support and must hold.
Dow (DIA) 333 first level of support and 339 resistance. As the only index above the 50-WMA, support at 329 is key.
Nasdaq (QQQ) 278 key level of support and 286 resistance. Still the weakest index. Hovering on major support at 278 or trouble ahead.
KRE (Regional Banks) 57 support and 63 resistance. After weeks of sideways action, last major support is at 57.00.
SMH (Semiconductors) 217 first level of support and 224 resistance. If SMH can lead, then 230 is the place to clear and take notice.
IYT (Transportation) 219 first level of support and 226 resistance. Another one to fail the 50-WMA. Now, 213 to 214 is key support.
IBB (Biotechnology) 127 key support and 137 resistance. This has been the year of do not chase breakouts. Like DIA above the 50-WMA and will see if can hold 127.
XRT (Retail) 63 first level of support and 67 resistance. Never got the clearance over 67.00 so now we watch 63 and 60 as strong support.
Twitter: @marketminute
The author may have a position in mentioned securities at the time of publication. Any opinions expressed herein are solely those of the author and do not represent the views or opinions of any other person or entity.


