When it comes to leadership in the stock market, the Biotech sector has filled that role quite well during this bull market. And it has been a great signal for market pullbacks and thrusts higher.
Here’s a look at how the Biotech sector ETF (IBB) did compared to the S&P 500 off the lows set in 2011 all the way up to the highs in 2015.
As you can see, the Biotech sector left the S&P 500 in the dust, gaining some 250% more.
Biotech Sector (IBB) vs S&P 500 Chart: 2011-2015
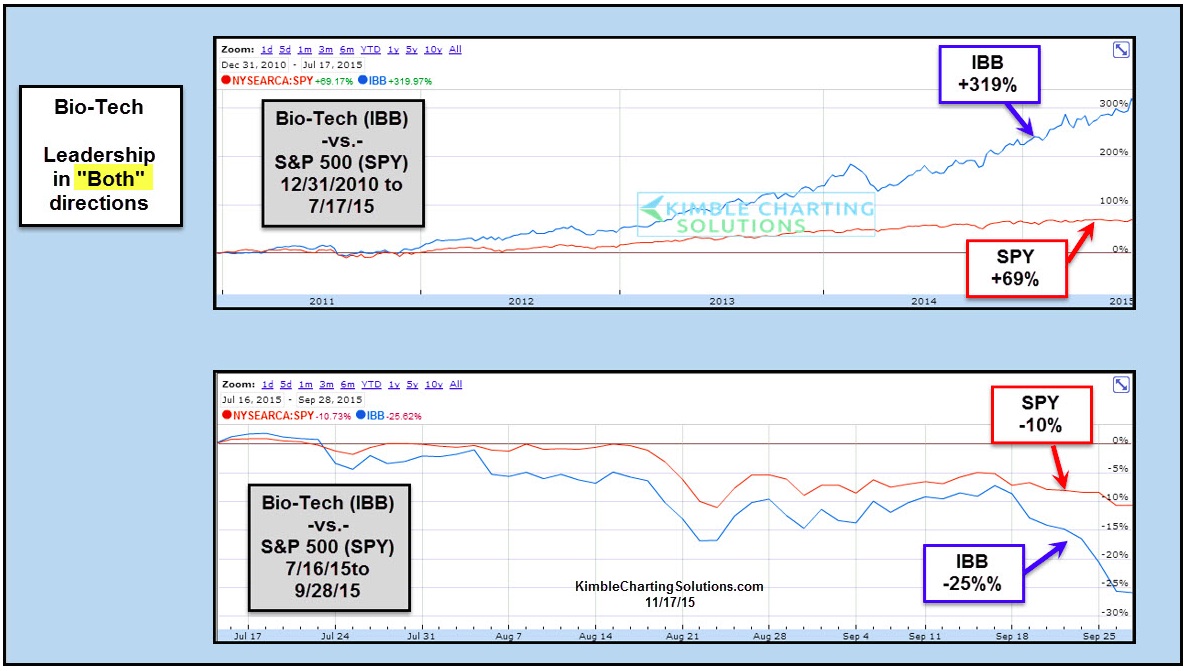
It’s worth noting, though, that the Biotech sector and some of its big player stocks led the S&P 500 lower this summer, as it fell sharply, and significantly more than the broad markets.
The chart below looks at the the current price pattern and chart setup for Biotech stocks (via IBB). Let’s just say that this market leader is facing a big (and important) test.
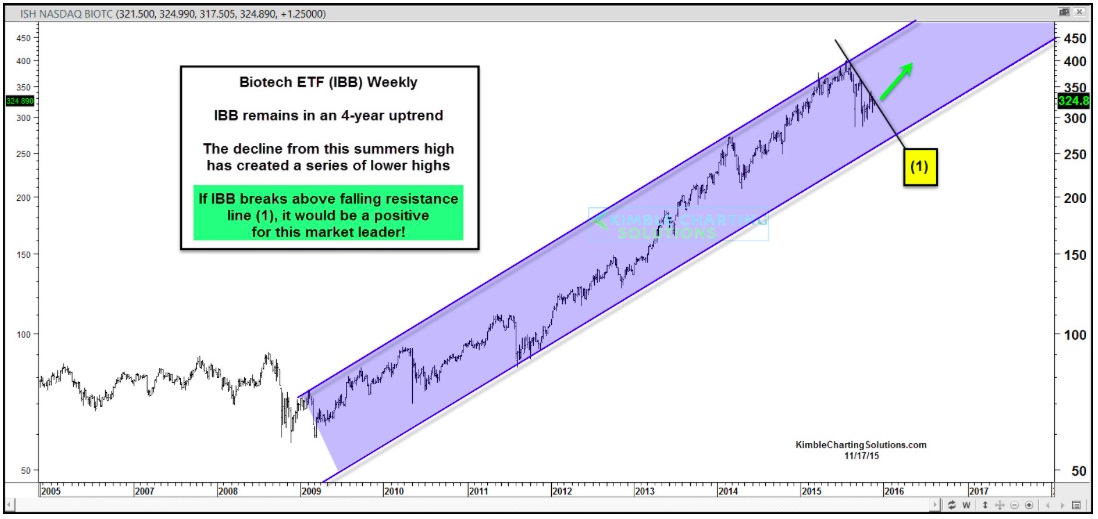
Biotech stocks remain inside a multi-year rising trend channel. The decline from this summers high did not break the lower side of the trend channel support, and a Biotech breakout may now in the cards. As you can see, the biotech sector has created a series of lower highs since July but the downtrend line is getting taken out. Should a Biotech breakout see follow through higher, it will be a good sign for the broader stock market.
Twitter: @KimbleCharting
Any opinions expressed herein are solely those of the author, and do not in any way represent the views or opinions of any other person or entity.

: Showing Some Signs of Emerging Strength")

