Yesterday we covered the Retail Sector XRT and how important the consumer is to the health of the US Economy.
Furthermore, we have been commenting on the transportation sector through IYT and how that plays a crucial role in the U.S. economy.
That sector has been underperforming.
Key aspects:
- Economic Contribution:
- Transportation services contribute approximately $1.2 trillion (equivalent to 5.4% of the U.S GDP)
- This sector encompasses various modes such as road, rail, air, and maritime transport, as well as logistics and warehousing services.
- Employment:
- Approximately 10.68 million Americans work in the transportation and warehousing industry.
- This workforce includes truck drivers, pilots, railway operators, logistics professionals, and more.
- Environmental Impact:
- Transportation emissions account for 27% of the total U.S. greenhouse gas emissions.
- Efforts to improve fuel efficiency and transition to cleaner energy sources are critical for sustainability.
- Freight Movement:
- The trucking industry is responsible for 72.5% of freight.
- Passenger Mobility:
- Passenger transportation, including air travel, public transit, and personal vehicles, enables people to commute, travel, and access essential services.
- Infrastructure Investment:
- Transportation infrastructure (roads, bridges, airports, etc.) requires ongoing investment to maintain and expand capacity.
- In 2021, the government passed a $1.1 trillion infrastructure bill. HOWEVER, there have been issues with implementation.
- Inflation costs
- Shortage of Construction workers
- Accountability of benchmarks and ROI
What we are interested in discerning is whether this recent underperformance is pointing towards a normal correction, a soft landing, recession or stagflation?
How IYT provides insights into potential economic downturns is the TSI:
- Transportation Services Index (TSI):
- Measures the volume of freight and passenger transportation services moved by the for-hire transportation sector in the United States.
- During economic expansions, we see higher transportation demand reflected by an increase in the TSI.
- Conversely, during recessions, reduced economic activity leads to a decrease in the TSI.
- Freight Transportation as an Early Indicator:
- The freight TSI tends to be a lead indicator. Thus, monitoring the freight TSI can provide early signals of economic shifts.
- Currently, the TSI peaked in 2020 but is far from flashing recession which would we begin to see if the indicator breaks below 130 or Covid lows.
- Transportation Stocks and Investor Sentiment:
- Transportation stock performance can also provide insights. If transportation stocks lag the broader market, it may signal investor concerns about a potential recession as we are potentially seeing now.
The TSI measures the output of transportation services comprised of two primary indices:
- Freight Index: Tracks changes in freight shipments.
- Passenger Index: Monitors changes in passenger travel.
As of February 2024, the Freight TSI stands at 138.1 (seasonally adjusted), reflecting the current state of freight transportation services.
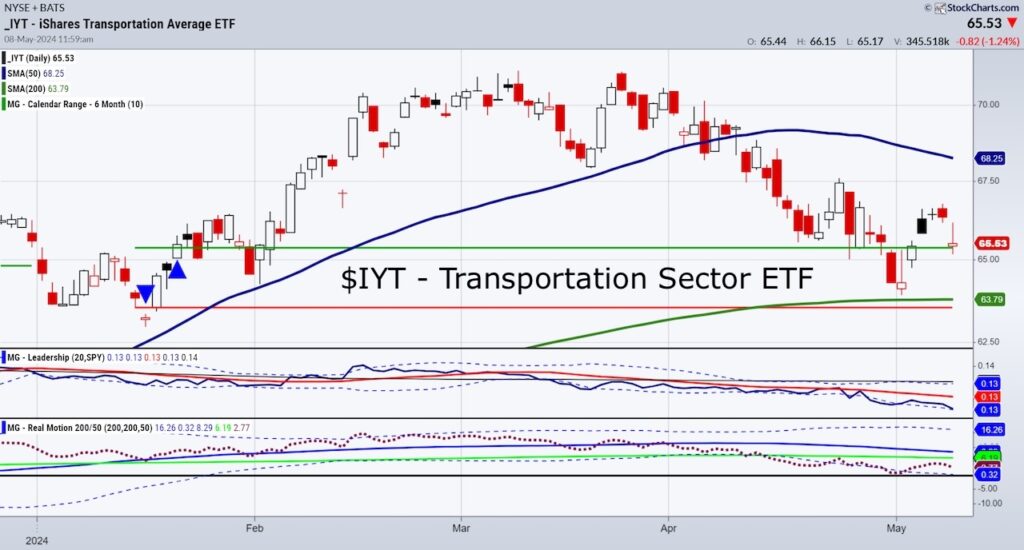
The chart of IYT shows the price back onto support at the 200-Daily Moving average.
IYT is well underperforming SPY.
Real Motion shows us a bearish divergence with momentum under the 200-DMA while price sits slightly above it.
At this point, XRT and IYT are telling us to expect more contraction in both consumer spending and in the freight TSI.
However, neither has fully confirmed that just yet.
Twitter: @marketminute
The author may have a position in mentioned securities at the time of publication. Any opinions expressed herein are solely those of the author and do not represent the views or opinions of any other person or entity.


