Gold remained elevated for much of this spring, but trading became “heavy”.
In trading terms, that’s when price stalls out in a consolidation pattern but fails to see big buying days. It then topples over on its own weight.
Today’s chart takes a look at an intermediate-term glimpse of the Gold ETF (GLD). As usual, I let the visual do the talking… while explaining why our favorite glitter could use a refresh.
Note that the following MarketSmith charts are built with Investors Business Daily’s product suite.
I am an Investors Business Daily (IBD) partner and promote the use of their products. The entire platform offers a good mix of tools, education, and technical and fundamental data.
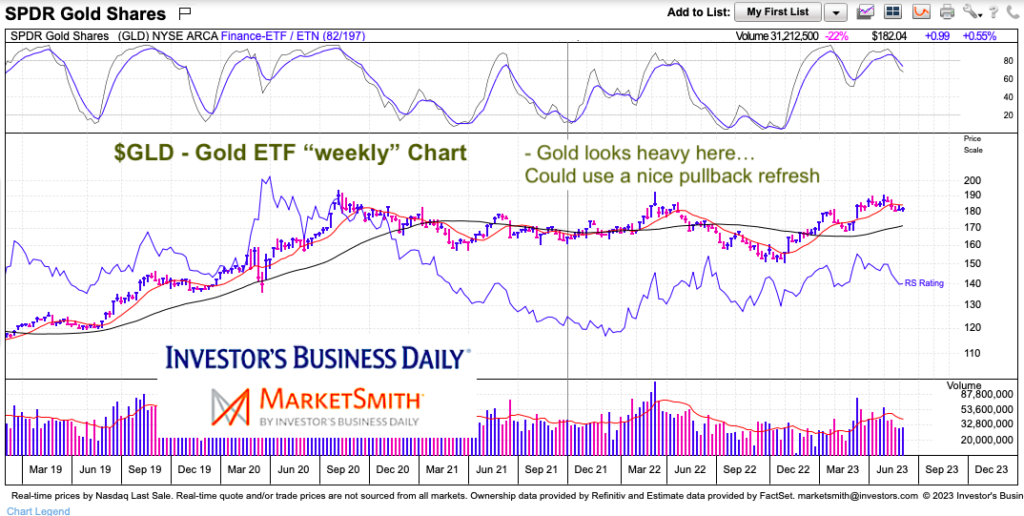
$GLD Gold ETF “weekly” Chart
As you can see, the Gold ETF (GLD) rose into April/May before stalling out. The weekly chart now has churned sideways-to-lower for 10+ weeks. And the latest move below the 10-week moving average suggests that a refresh may be in order. Moreover, I think that a quick flush would be bullish for bulls as price is still elevated and it could renew its move upward. Watch the 40-week moving average for support if we see a quick move lower…
Twitter: @andrewnyquist
The author may have a position in mentioned securities at the time of publication. Any opinions expressed herein are solely those of the author, and do not in any way represent the views or opinions of any other person or entity.

: Showing Some Signs of Emerging Strength")
