There’s been plenty of uncertainty in the air. From our economy to the stock market to politics to war abroad, consumers are concerned.
So we continues to look for facts, signals, and clues in the financial markets to tell us how to trade… but also what may come next.
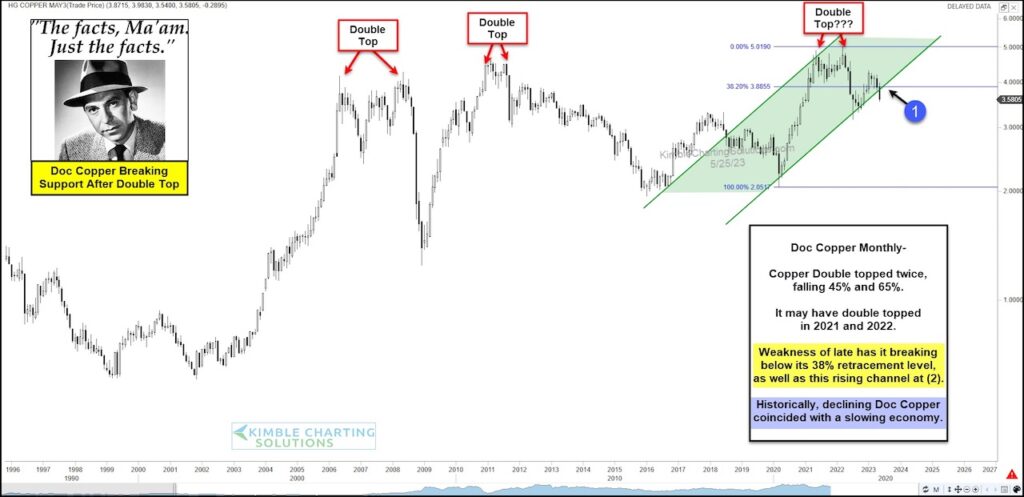
Today, we look at a long-term “monthly” chart of Copper Futures. When Copper is strong, the economy tends to be stronger. When Copper is weak, the economy tends to be weaker.
“The facts, Ma’am. Just the facts.” – Joe Friday
As you can see, Good ole Doc Copper formed yet another double top pattern (bearish) before weakness ensued. This weakness has Copper working on a dual breakdown of support at (1). This support is marked by the 38% Fibonacci level along with the rising uptrend line. So it’s important!
Currently, the price of Copper is breaking down through this support at (1). And this is concerning.
Historically soft copper has translated into a softer economy going forward. Stay tuned!
Copper Futures “monthly” Price Chart
Note that KimbleCharting is offering a 2 week Free trial to See It Market readers. Just send me an email to services@kimblechartingsolutions.com for details to get set up.
Twitter: @KimbleCharting
Any opinions expressed herein are solely those of the author, and do not in any way represent the views or opinions of any other person or entity.


