For the past 18 months, inflation concerns have taken center stage in the financial news headlines.
Could that be changing as we type?
One of the key components to inflation is commodity prices (crude oil, natural gas, corn, wheat, soybeans, etc…). And several have cooled off.
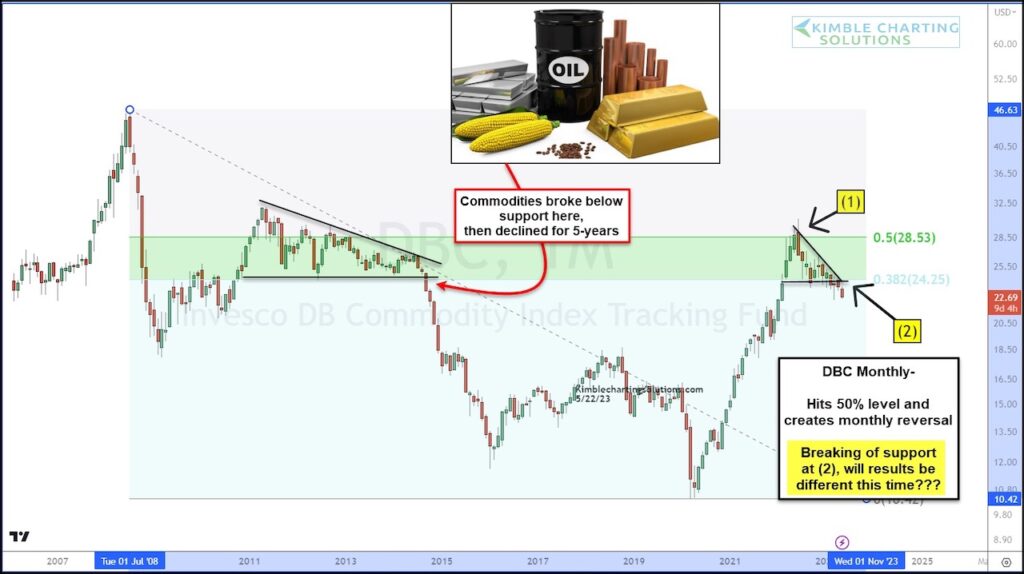
This can be seen in today’s chart – a “monthly” chart of the popular Commodities ETF (DBC).
As you can see, $DBC hit the 50% Fib retracement at (1) and reversed lower. The move lower created a triangle pattern, with the lower edge becoming support at the 38% Fib retracement at (2).
This month, it appears that the commodities ETF (DBC) is breaking below support at (2). This could be good for inflation.
The current triangle may be a fractal of the one formed a decade ago. And similarly, if DBC succeeds in breaking down, it could see a fairly large sell-off. This would be bullish for bonds… and take the air out of the inflation headline “bubble”. Stay tuned!
$DBC Commodities ETF “monthly” Chart
Note that KimbleCharting is offering a 2 week Free trial to See It Market readers. Just send me an email to services@kimblechartingsolutions.com for details to get set up.
Twitter: @KimbleCharting
Any opinions expressed herein are solely those of the author, and do not in any way represent the views or opinions of any other person or entity.


 Vying For Stock Market Leadership Role")


 Nears Important Pivot Point")