Candle charts are an important part of the technical analysis toolkit, helping traders to use visual queues to anticipate short-term trend reversals.
I remember speaking with candle expert Steve Nison many years ago in New York, where he stressed the value of using candle charts along with conventional “Western” technical indicators like moving averages and trendlines.
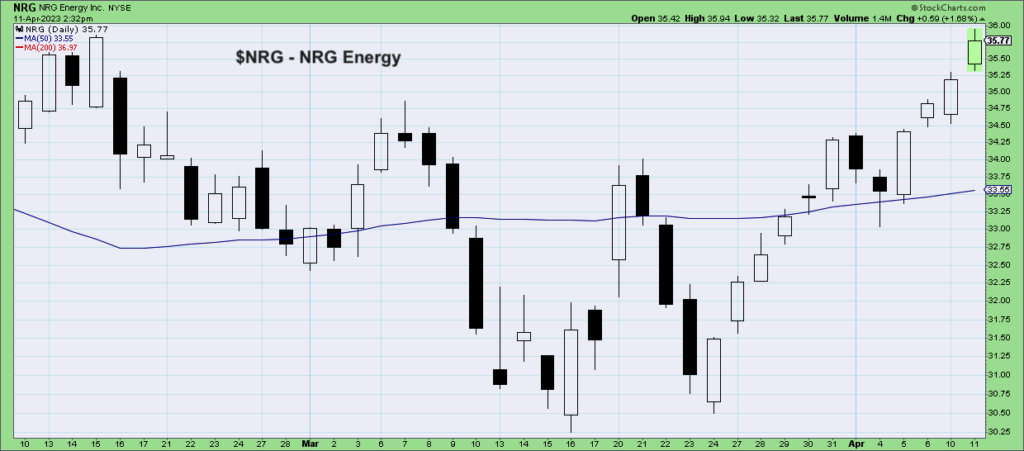
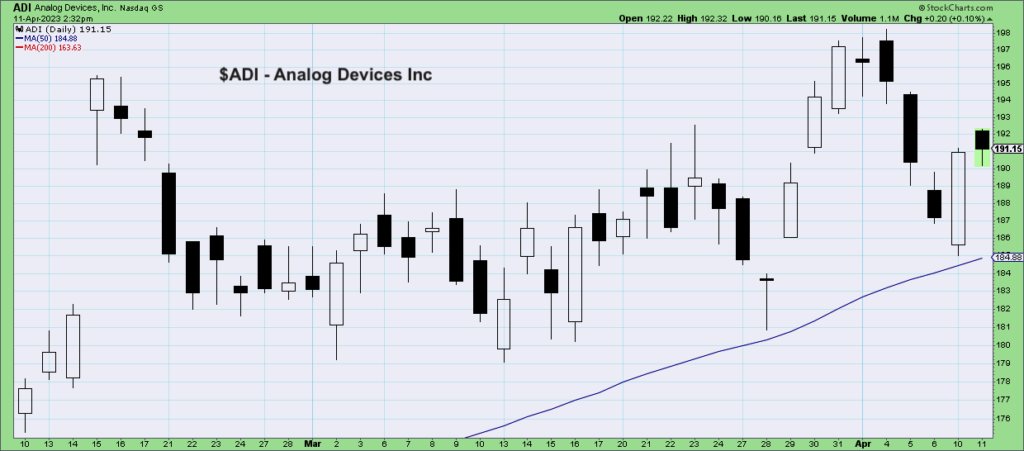
The Bullish Engulfing Pattern is a two-bar candlestick pattern that indicates a potential bullish rotation during a downtrend phase. I’ve found this to be one of the most effective ways of identifying a potential reversal, as the short-term sentiment has shifted from distribution to accumulation. In short, traders are buying on short-term price weakness.
In today’s video, we’ll review recent signals on two stocks, NRG and ADI (watch video and see charts further below). We will review the basics of this candle pattern and discuss how to manage risk using the actual range of the price pattern.
- What does this two-day candle pattern tell us about short-term sentiment?
- How can we use moving averages and support levels to corroborate or validate the candle pattern signal?
- What price levels can traders use to manage risk using candle charts, telling us when the signal is no longer valid?
[VIDEO] Bullish Engulfing Patterns Stock Tickers $NRG and $ADI
$NRG and $ADI Charts
Twitter: @DKellerCMT
The author may have positions in mentioned securities at the time of publication. Any opinions expressed herein are solely those of the author, and do not in any way represent the views or opinions of any other person or entity.


