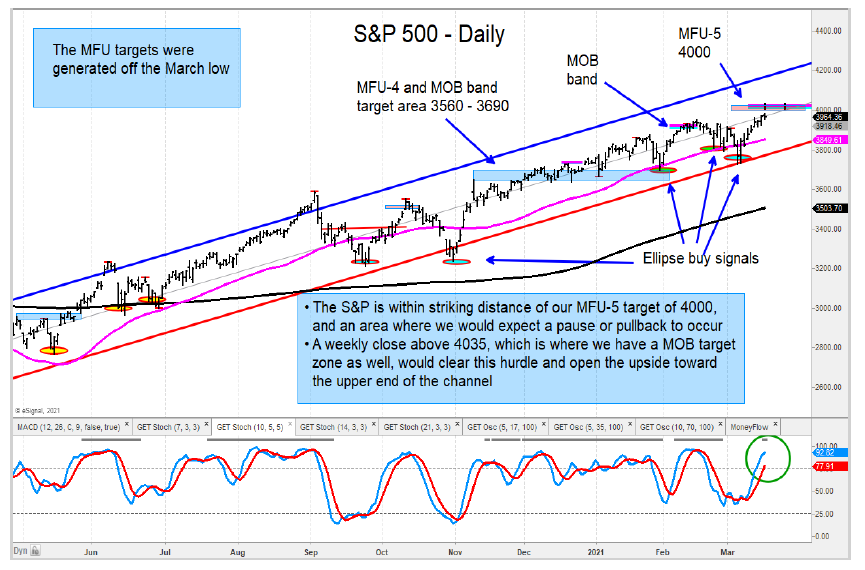
The S&P 500 Index is very close to our target level of 4000, which is where I am looking for a pause/pullback to occur.
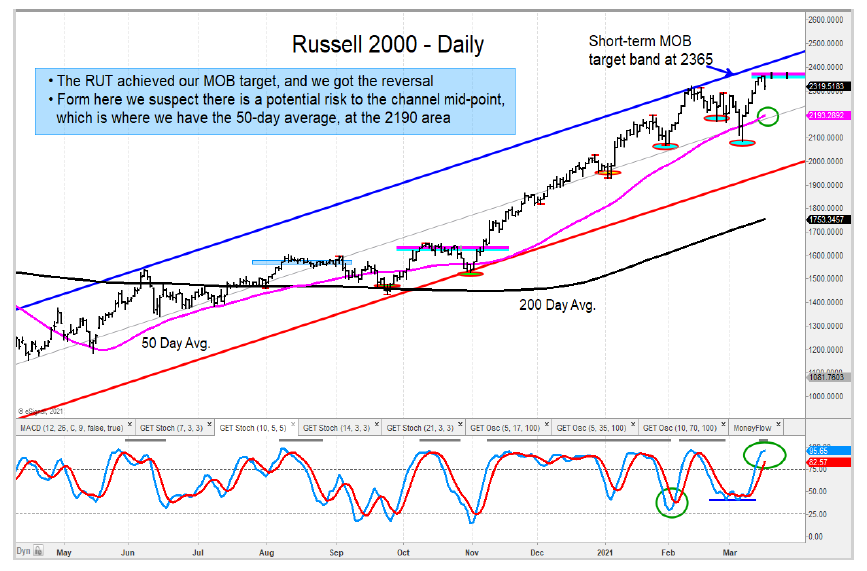
As well, we saw a reversal in the Russell 2000 after reaching its MOB price target band at 2365. I believe there is potential for further weakness short term. No sign of a major top, however.
The MidCap (MDY) is overbought short-term. I am looking to add to weakness.
On a brighter note, the Nasdaq Composite reversed off the MOB band and has now rallied back above the lower end of its channel line and 50-day average. A positive development.
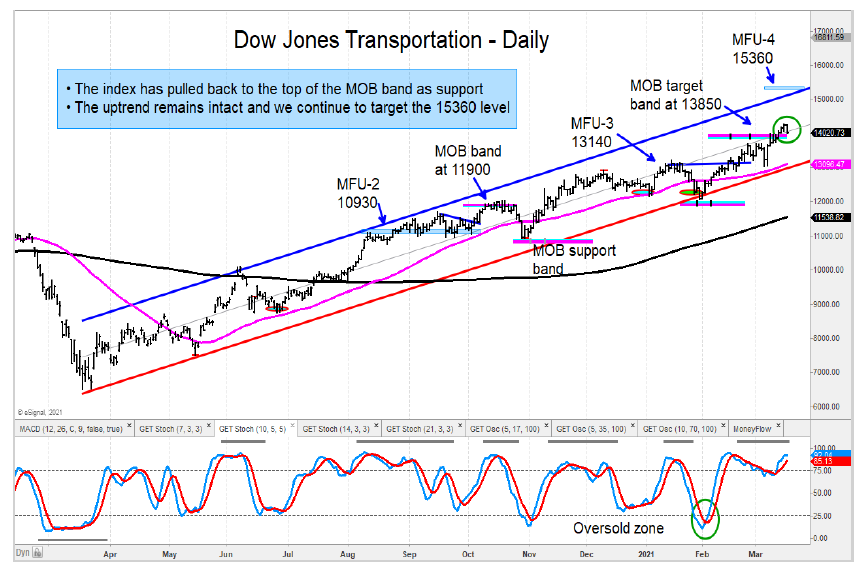
No change in the Dow Jones Transportation Average as the index remains in a favorable up-trend. I continue to like the airline group.
The relative chart of the Russell 1000 value to Growth reversed 1.5% shy of our price target and has broken below its uptrend. I suspect there is more weakness ahead.
The rally in the TLT was short lived after bouncing off our MFU-3 target. I thought there was a good chance of a stronger rally, which is typical at an MFU-3 level, but it failed. There is a measured target quite a bit lower from here, so our focus is on another leg lower.
Looking at sectors, the Energy ETF (XOP) got very close to our target of $93.50. I am taking profits on extended stocks and will wait to see what the pullback looks like before identifying a zone to add back.
Charts:
The author or his firm may have a position in mentioned securities at the time of publication. Any opinions expressed herein are solely those of the author, and do not in any way represent the views or opinions of any other person or entity.


")