The price of Crude Oil, Natural Gas, and related energy stocks have been decimated this year (2020).
The trends lower were already in place coming into the year, but the coronavirus crash and on-going lockdowns have delivered a near knock-out punch to the energy sector… and have energy investors (and related workers) hoping for a stimulus bill to pass so (even if as an indirect byproduct) the sector can recover a portion of its losses.
As I said, the trend has been in place for months/years. This is just plain obvious in the charts shared below. Note that the charts are less of an exercise in technical analysis as they are stand-alone story tellers. Perhaps the rise of solar power and alternative energies (and a stronger political push for these), combined with a slowing economy, will leave the traditional energy sector longing for more than just another stimulus bill.
Note that the following MarketSmith charts are built with Investors Business Daily’s product suite.
I am an Investors Business Daily (IBD) partner and promote the use of their products. The entire platform offers a good mix of technical and fundamental data and education.
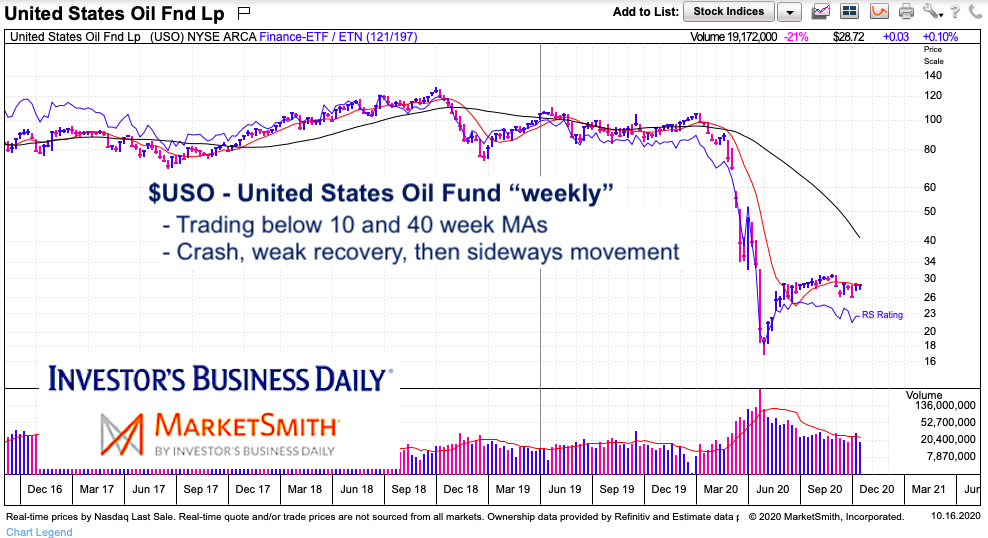
$USO US Oil Fund ETF “weekly” Chart
The US Oil ETF (USO) declined from over $100 per share down to the teens earlier this year. It is now trading closer to $30 per share and testing its 10-week moving average. It is well below its sharply declining 40-week moving average. Ugly chart.
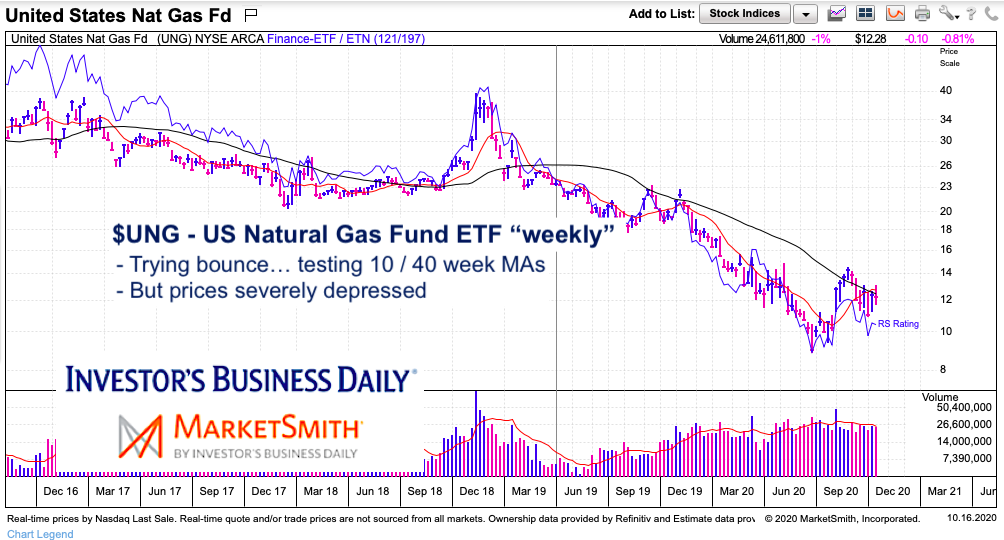
$UNG US Natural Gas Fund ETF “weekly” Chart
Same “story” as above, although natural gas didn’t bottom until late summer. Natural gas also appears to be in the midst of a rally and is testing its 10/40 week moving averages.
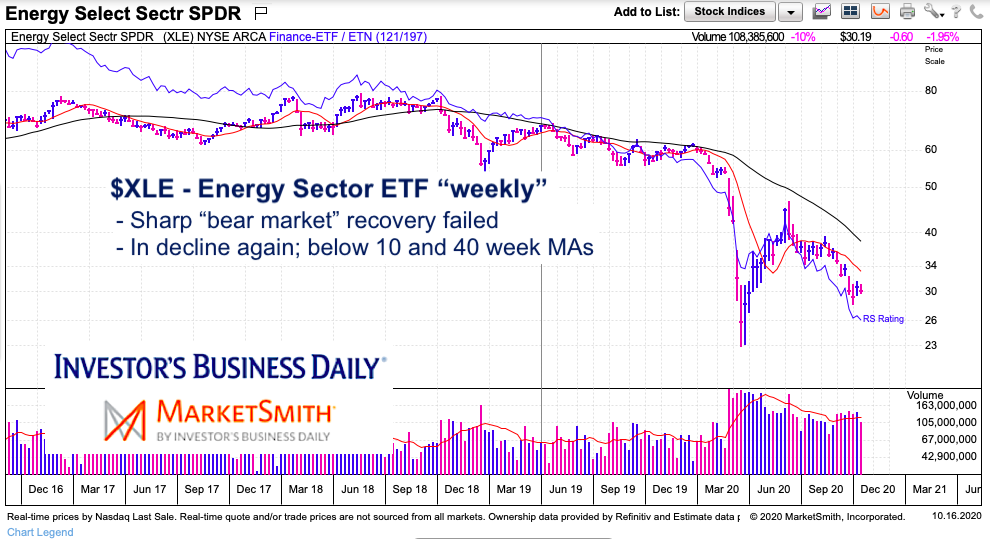
$XLE Energy Sector ETF “weekly” Chart
Overall, the Energy Sector ETF (XLE) is in a multi-week downtrend that is backtesting its March low. XLE is trading below its 10/40 week moving averages. It is also in a multi-month downtrend. Not pretty.
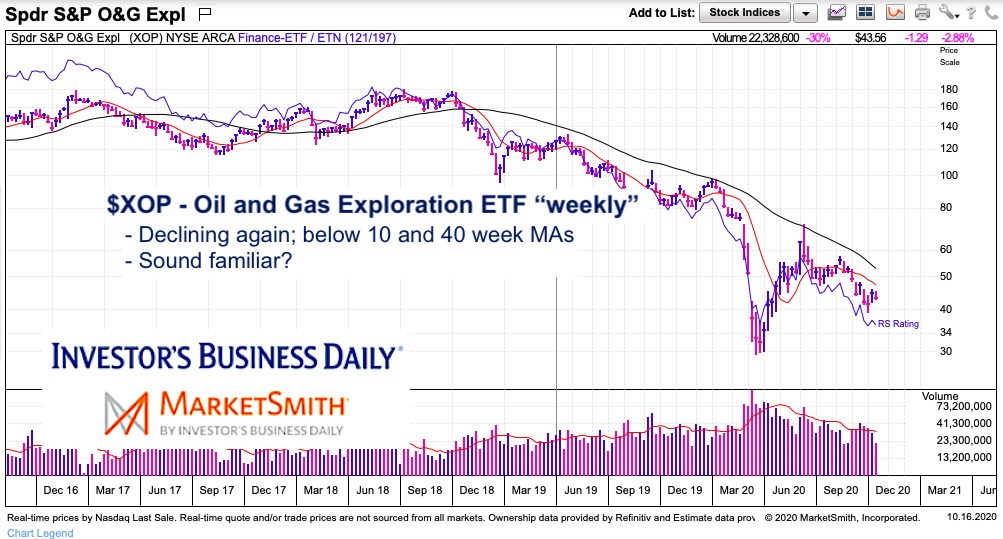
$XOP Oil and Gas Exploration Sector ETF “weekly” Chart
The oil and gas exploration industry is in rough shape. Again we have a multi-month downtrend with price trading below its key weekly moving averages. Ugly chart.
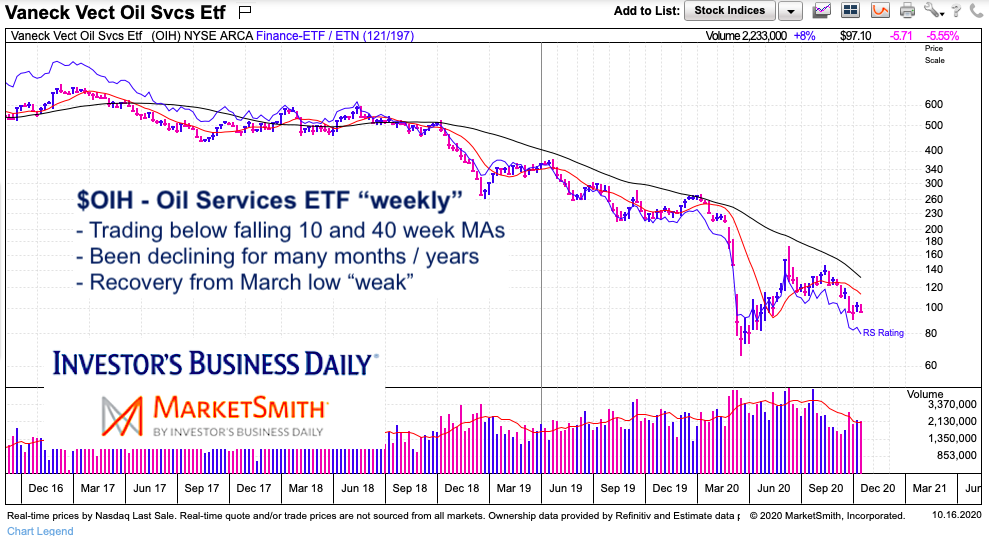
$OIH Oil Services Sector ETF “weekly” Chart
The Oil Services Sector ETF (OIH) is trading in a multi-year downtrend. It is below its key weekly moving averages and very weak. More stimulus, please.
Twitter: @andrewnyquist
The author may have a position in mentioned securities at the time of publication. Any opinions expressed herein are solely those of the author, and do not in any way represent the views or opinions of any other person or entity.


 Ready To Break Out?")

