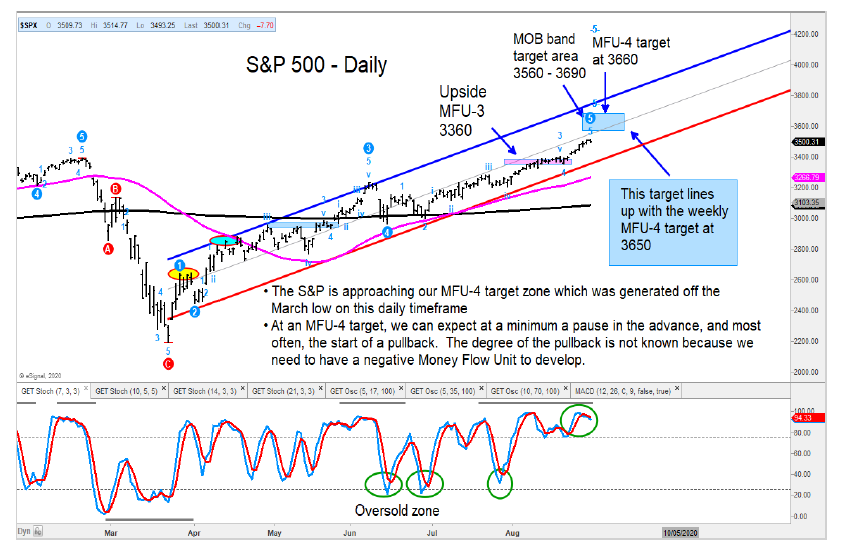
The S&P 500 continues to grind higher in a well-defined upward sloping channel. The index has a target area based on the Make or Break band and our Money Flow Unit analysis between 3560 and 3690.
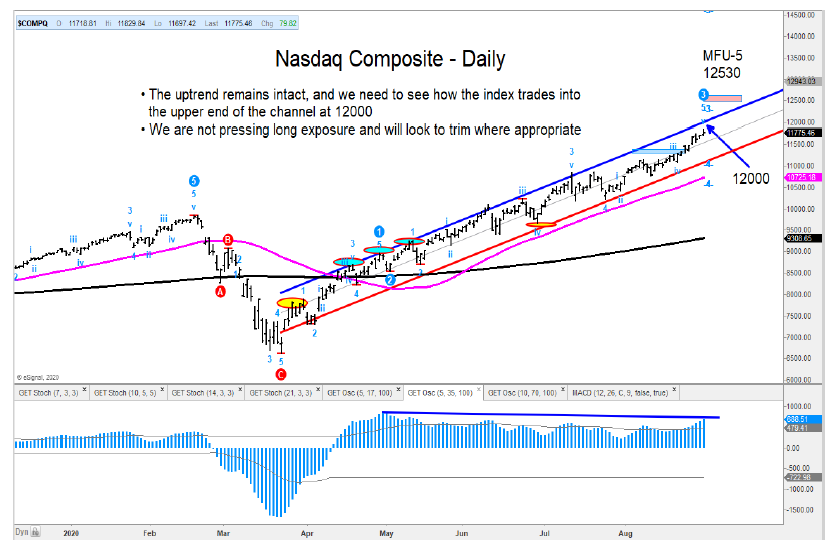
The same solid uptrend is true for the Nasdaq Composite, but here too, the index is getting close to a target area where we would expect a pause/pullback.
The uptrends for both the S&P 500 and Nasdaq Composite remain intact but approaching price target zones where I will be looking for a pause or pullback.
I am concerned with the loss of upside momentum for the Russell 2000 and Mid-Cap (MDY) after coming into an area of resistance and target levels. It may be prudent to reduce exposure to those segments of the market.
The ratio chart of the Momentum Factor (MTUM) ETF vs. The S&P 500 Low Volatility ETF has achieved the MOB target highlighted on August 18. I think it’s wise to take some profits right here.
I remain bearish on TLT, the long-term US treasury bond ETF.
The Dow Transports are very overbought and into the highs of 2019. Weekly momentum, as measured by the stochastics, has started to turn down. See charts below.
S&P 500 Index “daily” Chart
Nasdaq Composite “daily” Chart
The author has a position in mentioned securities at the time of publication. Any opinions expressed herein are solely those of the author, and do not in any way represent the views or opinions of any other person or entity.


