Precious metals have been a red-hot investment in 2020.
Gold briefly broke $2000 this month, while Silver touched up near $30.
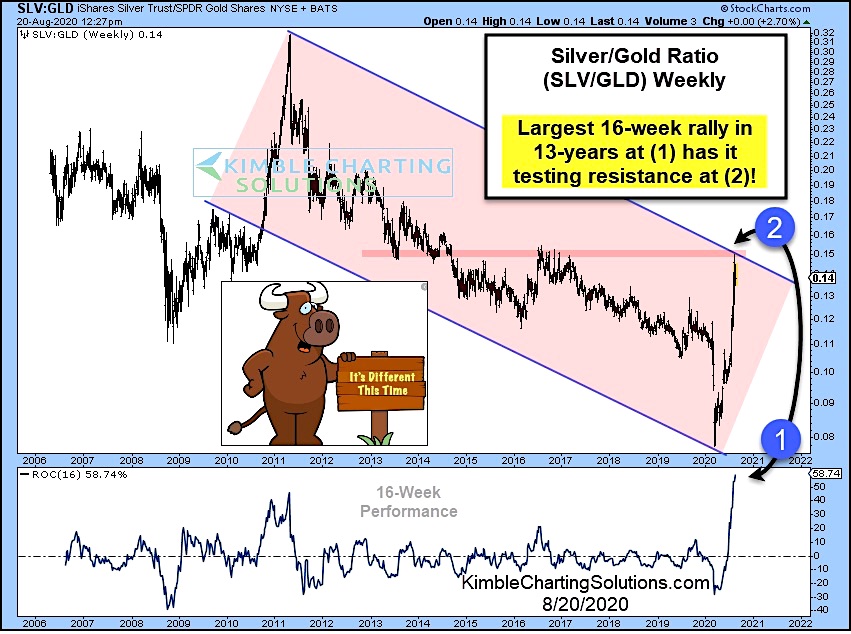
But it’s been the rally in Silver prices that has been eye-popping. And perhaps a big reason for the extra momentum we saw this summer in precious metals.
Typically, when silver outperforms gold, it adds “beta” and leads to good things for precious metals.
In today’s chart, we capture this with via the Silver (SLV) to Gold (GLD) ratio.
While the ratio has been in a downtrend for the past 9 years – see (1) and (2) – the ratio has rallied sharply over the past 4 months. In fact, the ratio posted its largest 16-week rally in 13 years.
So what do we make of this?
First off, it’s testing resistance so it shouldn’t be surprising to see precious metals take a breather here. That said, if/when we see a breakout over the downtrend line, it will be very bullish. Stay tuned!
Silver/Gold Ratio Chart
Note that KimbleCharting is offering a 2 week Free trial to See It Market readers. Just send me an email to services@kimblechartingsolutions.com for details to get set up.
Twitter: @KimbleCharting
Any opinions expressed herein are solely those of the author, and do not in any way represent the views or opinions of any other person or entity.


")