The bear market rally off the March 23 crash stock market lows played out as expected.
On March 25, I shared a series of Fibonacci retracement charts on Twitter. You can see those tweets further below.
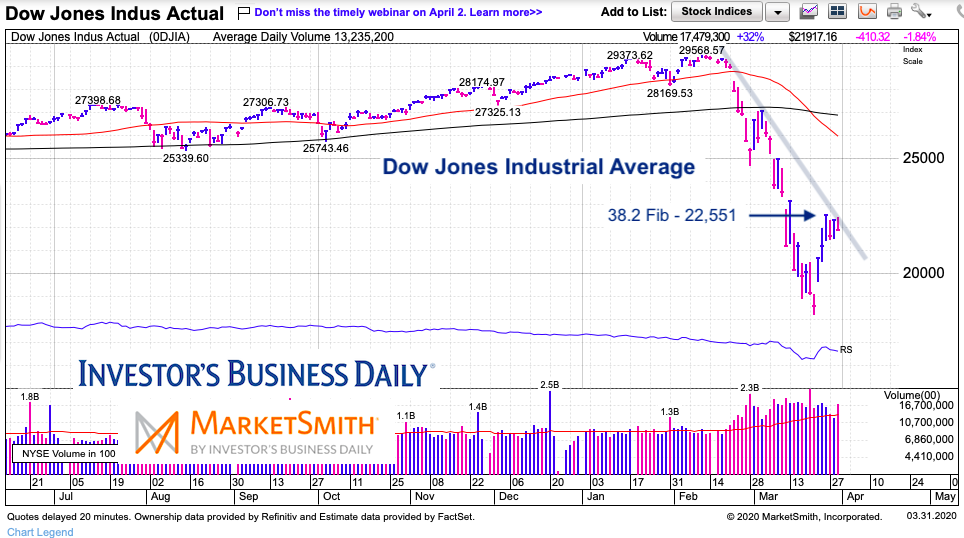
I noted that the main block of resistance to watch was at the 38.2 Fib. And that area held up like a stone wall into quarter end. Here are the recovery highs thus far versus the 38.2 Fib across the major stock market indices: Dow Jones Industrial Average (22,595 vs 22,551), Nasdaq Composite (7,880 vs 7,856), S&P 500 Index (2,652 vs 2,641).
While the rally may resume, it likely won’t happen before a significant pullback and/or retest of the lows. After a market crash that saw the Dow Industrials decline 38 percent and a pandemic that has brought the economy to a stand-still, a v-bottom seems like an ambitious expectation. My thinking is that we see another move lower before we begin to crawl back higher as price volatility finally leaves the marketplace.
Note that the following MarketSmith charts are built with Investors Business Daily’s product suite.
I am an Investors Business Daily (IBD) partner and promote the use of their products. The entire platform offers a good mix of technical and fundamental data and education.
Dow Jones Industrials Chart – End of 1st Quarter (March 31)
One additional note: Should the pullback gain steam, watch the 61.8 fib level at 19,888. That level needs to hold or it’s likely we’ll see a full retest of the lows or new lows.
Here are my Fibonacci tweets from March 25:
Fib Tweet #1
— Andy Nyquist (@andrewnyquist) March 25, 2020
Dow Jones Industrial Average: Fibonacci retracements#IBDpartner
Watching 38.2 Fib resistance (22,551).@IBDinvestors –> https://t.co/yXO84hqFwj pic.twitter.com/G0rrI32kn5
Fib Tweet #2$COMPQ Nasdaq Composite: Fibonacci retracements#IBDpartner
— Andy Nyquist (@andrewnyquist) March 25, 2020
Watching 38.2 Fib resistance (7,856).@IBDinvestors –> https://t.co/yXO84hqFwj pic.twitter.com/Ev6GtoDBrO
Fib Tweet #3$SPX S&P 500 Index: Fibonacci retracements#IBDpartner
— Andy Nyquist (@andrewnyquist) March 25, 2020
Watching 38.2 Fib resistance (2,652).@IBDinvestors –> https://t.co/yXO84hqFwj pic.twitter.com/6rYRpg3OZI
Twitter: @andrewnyquist
The author may have a position in mentioned securities at the time of publication. Any opinions expressed herein are solely those of the author, and do not in any way represent the views or opinions of any other person or entity.


 Ready To Break Out?")

