Stocks are chugging along here, but don’t get complacent. Especially if you are an active investor.
The S&P 500 Index is up 3.8% for the month. A pretty “thankful” month for bulls.
But the stock market is short-term overbought and nearing a potential price resistance / price target area.
In today’s chart, we look at a key confluence of short-term price resistance that may bring a pullback / dip. Again, this chart is short-term and meant for active investors.
Note that the following MarketSmith charts are built with Investors Business Daily’s product suite.
I am an Investors Business Daily (IBD) partner and promote the use of their products. The entire platform offers a good mix of technical and fundamental data and education.
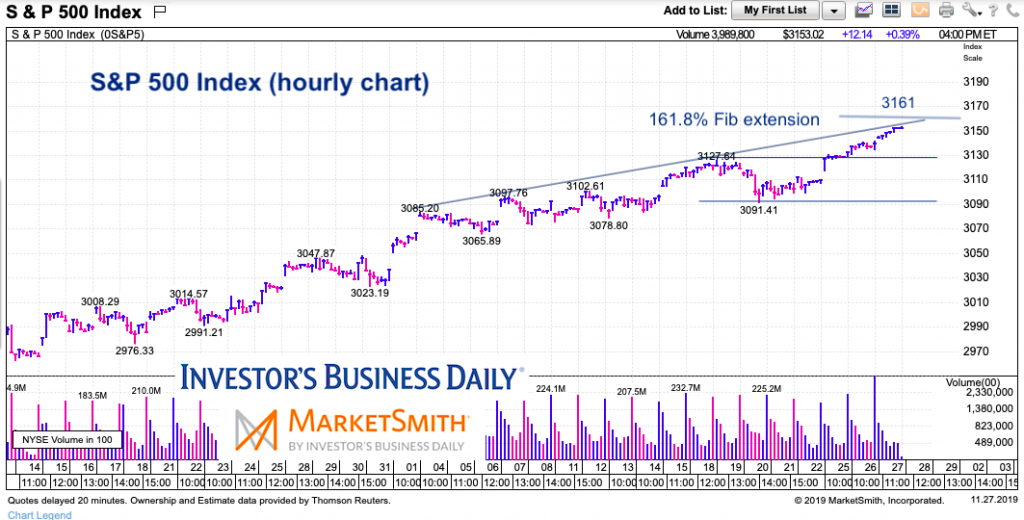
S&P 500 Index “hourly” Chart
This is an hourly bar chart. It does a pretty good job of highlighting the up-trend (lower left to upper right). Using recent trajectory along with a near-term fibonacci extension (161.8%), we can see that the 3160-3165 price area may provide some resistance. Again, just another way to look at the S&P 500 Index for active investors. Happy Thanksgiving to you and yours.
Twitter: @andrewnyquist
The author may have a position in mentioned securities at the time of publication. Any opinions expressed herein are solely those of the author, and do not in any way represent the views or opinions of any other person or entity.
")


")
