S&P 500 Index Chart
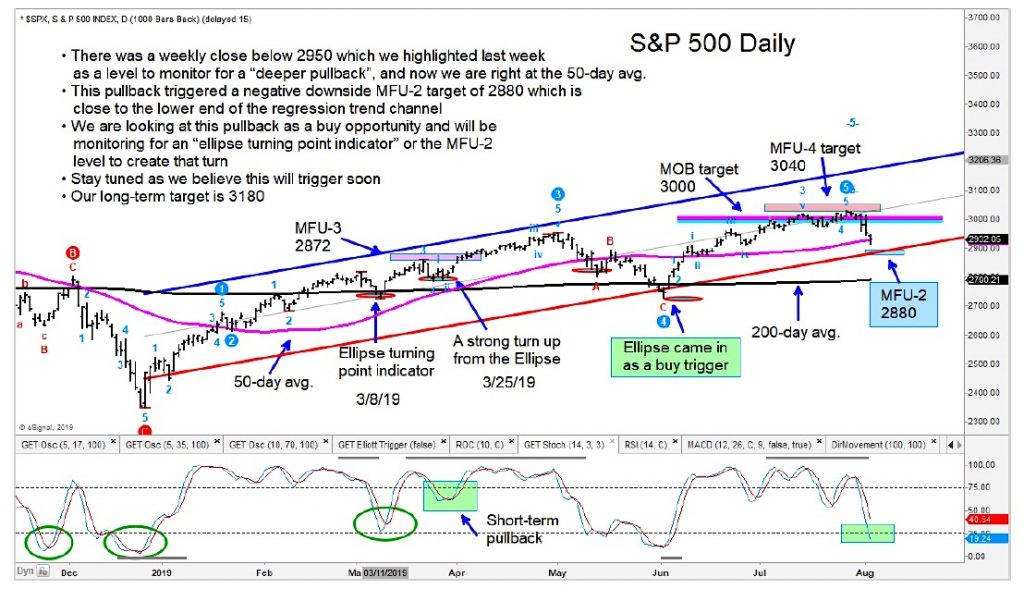
The S&P 500 Index INDEXSP: .INX declined through trading support at 2880 and may now be set to test an Ellipse turning point indicator, with a range of 2814-2830.
Just below that price area is our MFU-3 money flow price target of 2806 (not shown on chart).
Tuesday’s move higher appeared to be positive, but futures are trading lower today.
This area should offer good risk/reward for a tactical longs with a stop just under the 200 day average (2790).
If things get overdone with more negative news headlines and selling, then we see near-term risk down to 2730.
Our intermediate to long-term target of 3180 remains intact.
The author may have positions in mentioned securities at the time of publication. Any opinions expressed herein are solely those of the author, and do not in any way represent the views or opinions of any other person or entity.


