Just as the stock market has snapped back from the December lows, so has the Energy Sector and stocks.
However, it’s lagged the broad market. And may be putting in a short-term top here.
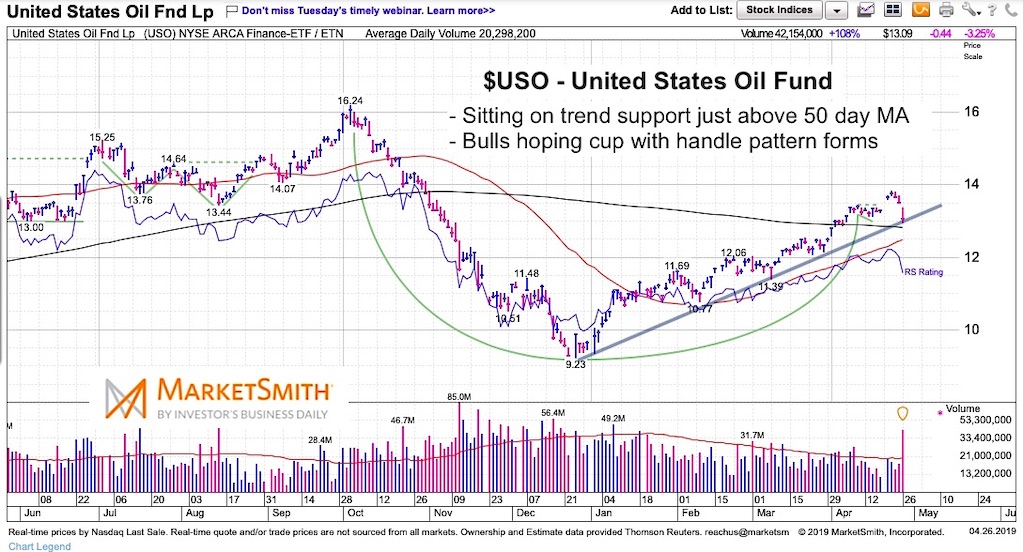
The sector takes its cues from oil. And while oil (NYSEARCA: USO) has been marching higher, it reversed course sharply last week.
It’s wobbling on its up-trend line. And although a retest of the highs isn’t out of the question, it looks like its getting heavy.
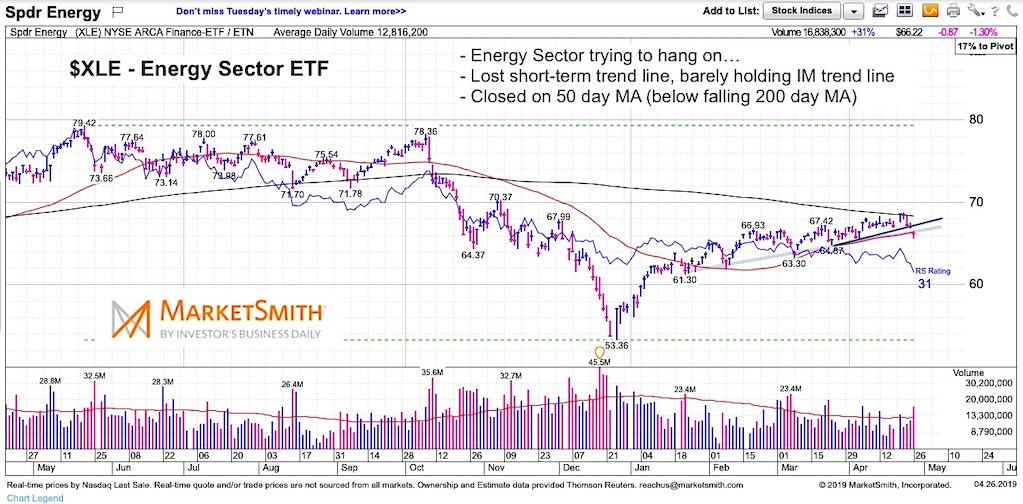
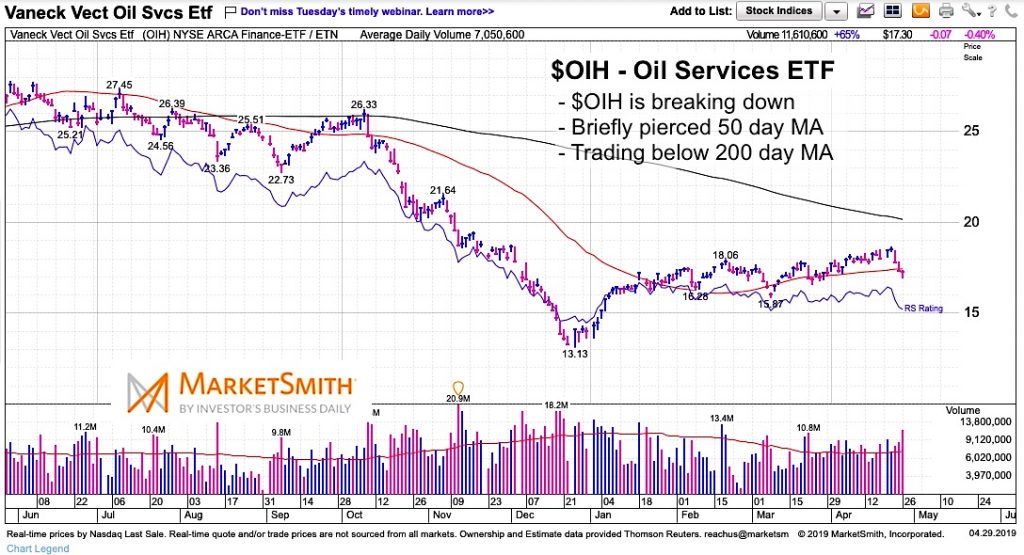
As well, Oil related stocks in the Energy sector are beginning to show cracks. The broad SPDR Energy Sector ETF (NYSEARCA: XLE) and Oil Services ETF (NYSEARCA: OIH) are both pressing hard on their respective up-trend lines. Probably best careful with longs here… and to be patient with the sector if prospecting. Let’s review the charts.
Note that the following MarketSmith charts are built with Investors Business Daily’s product suite.
I am an Investors Business Daily (IBD) partner and promote the use of their products. The entire platform offers a good mix of technical and fundamental data and education.
$USO United States Oil Fund Chart
The good news is that the 50 day moving average is rising and the Friday’s decline closed on the trend line. The bad news is that it has little margin for error here and the 200 day moving average is declining.
This makes that $14 resistance level a tough nut to crack near-term. It could also imply that the next rally falters.
$XLE SPDR Energy Sector Chart
Holding on. $XLE has a similar structure to $USO.
It’s been underperforming the market during the 4 month stock market rally. This is concerning and may require a pullback and rotation before moving higher.
$OIH Oil Services ETF Chart
Barring an immediate recovery early this week, the trend for Oil Services stocks looks to be broken. $OIH is firmly below the 200 day moving average and broader downtrend line.
Twitter: @andrewnyquist
The author has a position in mentioned securities at the time of publication. Any opinions expressed herein are solely those of the author, and do not in any way represent the views or opinions of any other person or entity.

: Where’s the Deflation in This?")


: Where’s the Deflation in This?")
