What?!? How can this be? The stock market rocketed higher the past 5 days… how can you not be bullish, you ask?
To be honest, I sold all my longs late last week and went short this week via short Index ETFs – a 40 percent position size as of today. And I’m looking to add tomorrow.
I’m a swing trader and I’m opportunistic on both sides of the ledger. I raised a lot of cash into January and used much of it to go long the market during the correction. I was very bullish, adding into weakness and fading strength (rinse/repeat) thereafter. And it worked well for me.
I have a bullish intermediate view of U.S. stocks. Yes, I continue to be bullish the broader U.S. stock market… even though I am short here for a trade.
It’s really the next handful of weeks that are troubling me.
Below are several MarketSmith charts from Investors Business Daily’s product suite.
Note that I use them for charting, data sorts, and comparative analysis. I’m also an IBD partner – you can gain access here: https://ow.ly/Fzzt30lnZZt
Before I get into the charts, it’s worth noting that I began trimming my “long” index account back in July (I sold my final “ETF” position in that account last week). My concerns had to do with several divergence, namely the Nasdaq / Russell 2000 new highs vs the lack of new highs on the S&P 500 and Dow Jones Industrials. Read more here.
Additional factors that have me concerned are a broadening formation on the Dow Jones Industrials, as well as a lack of breadth thrust on the S&P 500. While the S&P 500 poked new all-time highs today, it acted like it had never been there before and retreated quickly. We often get that reaction at new all-time highs. On the bullish ledger, it’s worth noting that the Russell 2000 also made new highs and held them into the close. Can it hold them for more than a few days? The 10 year treasury yields has been pulling back and the VIX closed the day much higher than recent lows… just thoughts.
In sum, I think any strong advance should involve ALL indexes. This will require the Dow Industrials and S&P 500 to play along.
I believe that they will… but not before a pullback.
Here’s the charts:
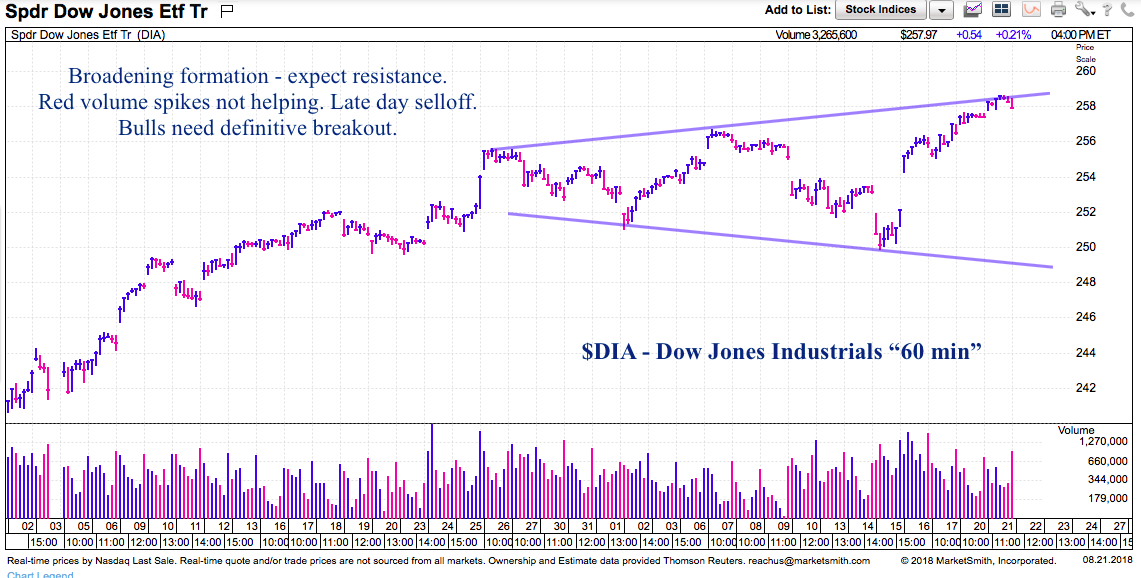
Dow Jones Industrials “60 minute”
Broadening pattern should provide resistance for Dow Industrials. I highlighted this last Friday on Twitter.
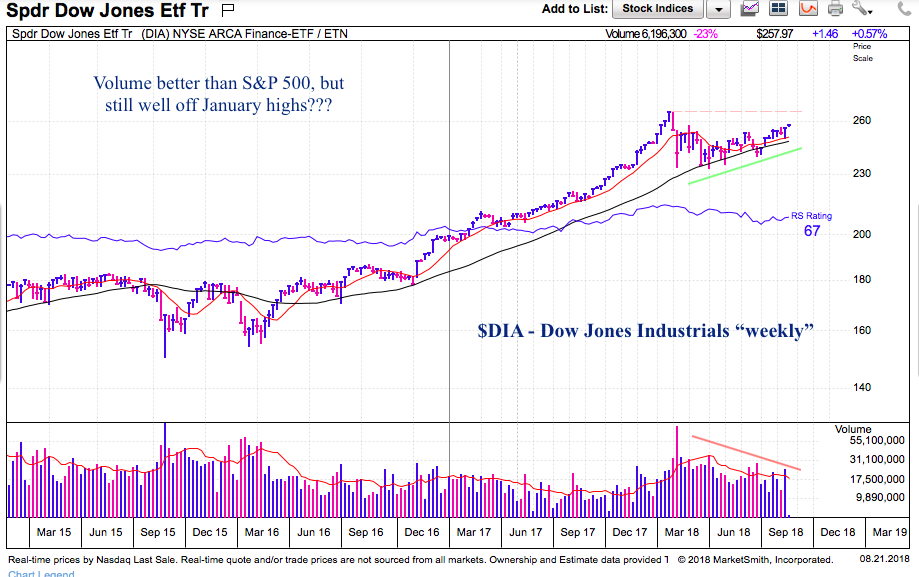
Dow Jones Industrials “weekly”
The weekly chart shows just how far off the Dow Industrials are from making new all-time highs (above the January high). As noted, the Russell 2000 and Nasdaq broke above the January high a while back. Note the Dow Industrials MarketSmith/IBD RS rating at 67 and drifting.
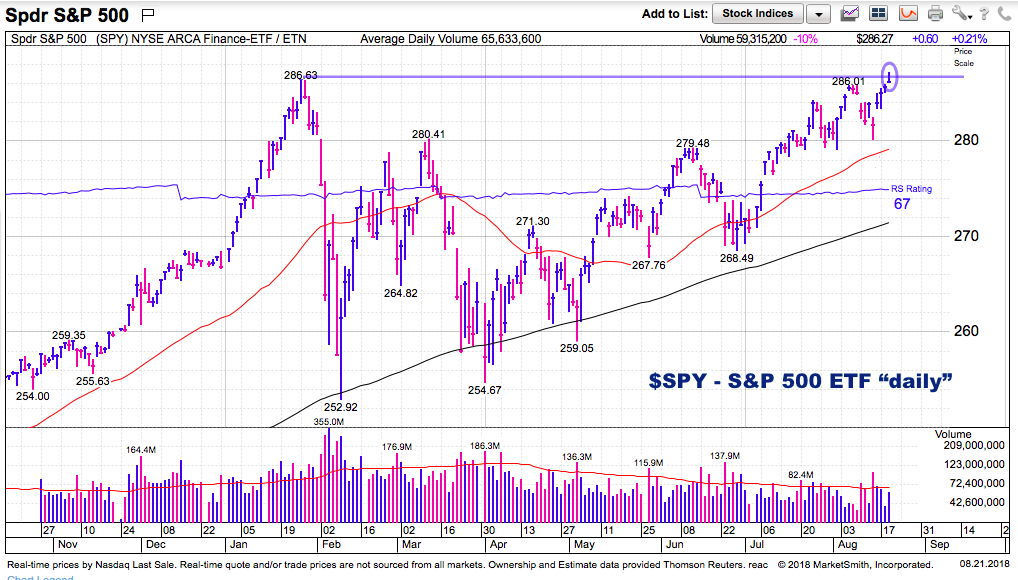
S&P 500 “daily”
The broad market barometer is testing all-time highs (from January). It poked through to new highs today, but retreated into the close. i use the 2 percent breakout rule… so this needs to last more than a few days to be legit.
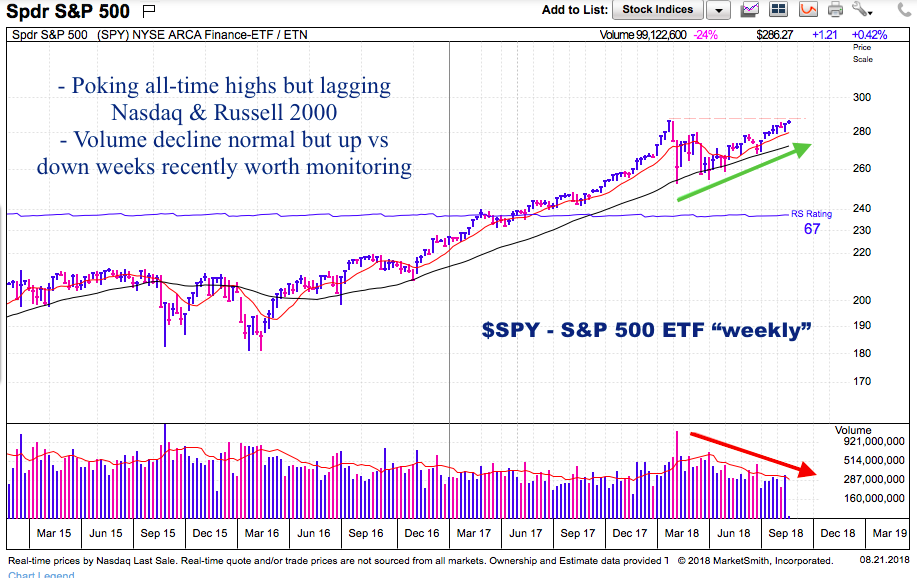
S&P 500 “weekly”
Broader look. Big resistance here… will take more than a hot butter knife to get through.
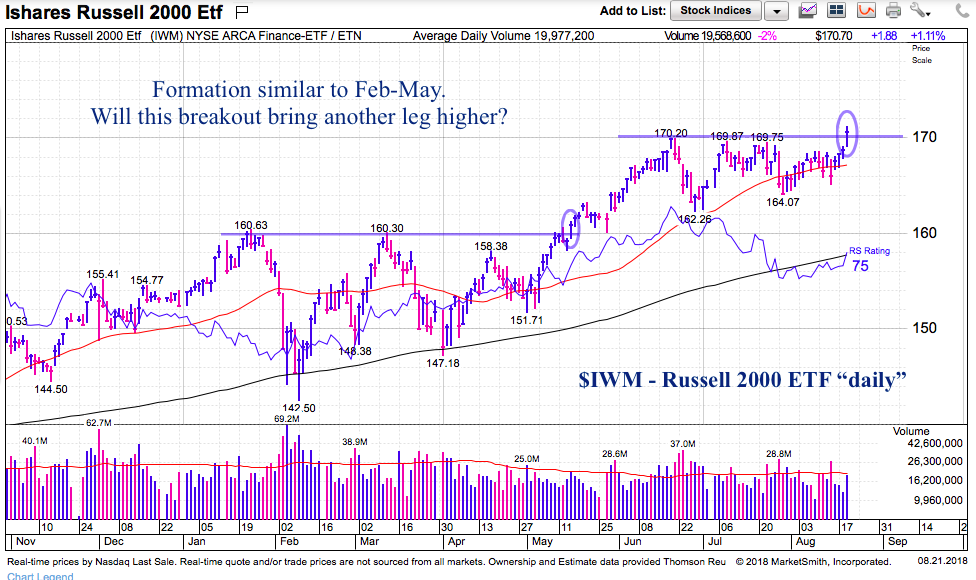
Russell 2000 “daily”
The Russell 2000 continues to be a market leader. The strong dollar and U.S. focus for equity concentration has invigorated the small caps. Key question: Is this an enduring breakout?
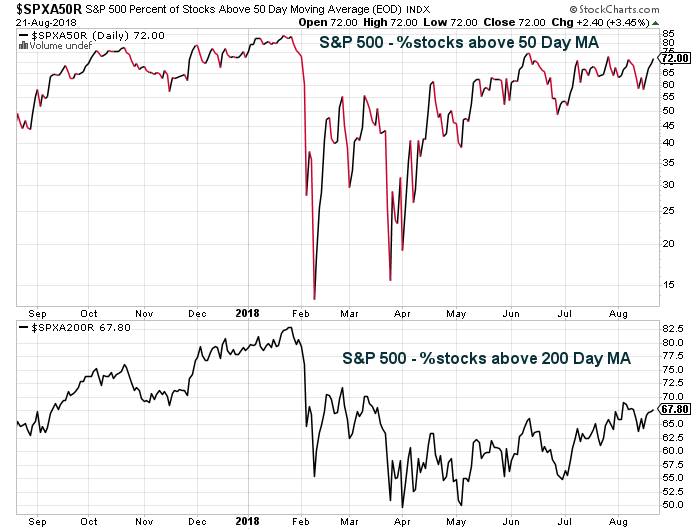
S&P 500 “market breadth”
The percent of stocks above their 50 day and 200 day moving averages is less than the January high. Percent stocks above the 200 day MA is particularly weak.
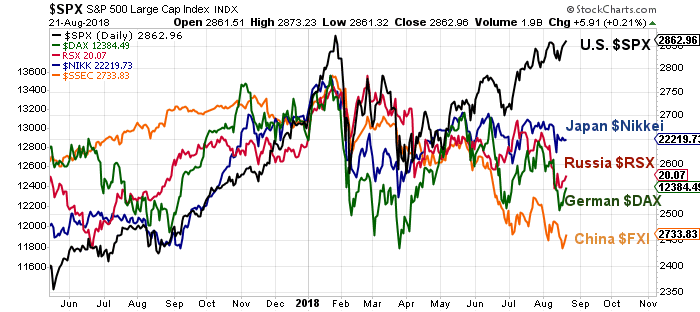
Global Index Performance
The U.S. has been the only game in town for several months. But the accumulation of forces should keep the broader market at bay (or lower) for the coming weeks. I’ve been wrong before… but that’s the life of a trader. Set your stops.
Twitter: @andrewnyquist
The author has a short position in the S&P 500 via SDS at the time of publication. Any opinions expressed herein are solely those of the author, and do not in any way represent the views or opinions of any other person or entity.


")