The following chart and data highlight non-commercial commodity futures trading positions as of June 5, 2018.
This data was released with the June 8 COT Report (Commitment of Traders). Note that this chart also appeared on my blog.
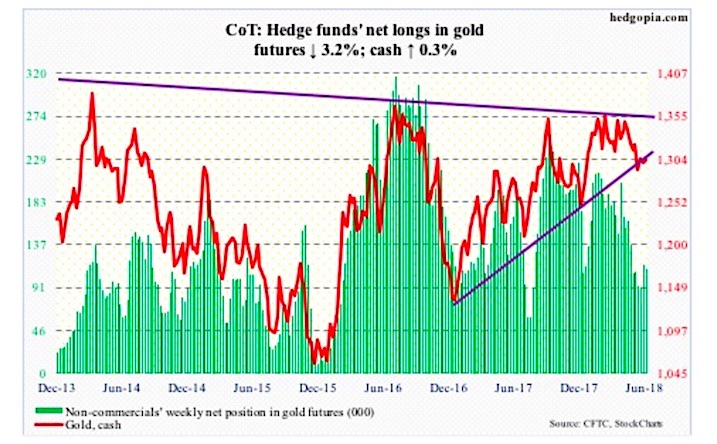
The chart below looks at non-commercial futures trading positions for Gold. For the week, spot Gold prices climbed higher by +0.3%.
Here’s a look at Gold futures speculative positioning. Scroll further down for commentary and analysis.
Gold Futures: Currently net long 111.4k, down 3.7k.
Gold-focused ETFs continue to bleed. In the week through Wednesday, SPDR Gold ETF (GLD) lost $777 million and iShares Gold Trust (IAU) $184 million (courtesy of ETF.com). In the last four, the two lost a combined $1.6 billion.
These outflows likely robbed the bulls of an opportunity of retaking the 200-day ($1,309.09/ounce) as well as broken-support-turned-resistance at $1,300-plus.
After losing the average on May 15, the cash ($1,302.70) is sideways to slightly up. From this perspective, gold digested the outflows well. Three weeks ago, gold bugs also defended support at $1,280s, which represents a rising trend line from December 2016. As long as this support holds, they deserve the benefit of the doubt.
Twitter: @hedgopia
Author may hold a position in mentioned securities at the time of publication. Any opinions expressed herein are solely those of the author, and do not in any way represent the views or opinions of any other person or entity.

 Set For Revival?")


 Set For Revival?")