The equity markets have experienced the first significant stock market correction since June 2016.
Stocks fell 5.0 percent last week and are down 10 percent from the record high on January 26. A 10 percent correction typically happens every 18 months, making the stock market’s recent plunge a normal occurrence.
A combination of factors helped to trigger the sharp drop including rising long-term interest rates, fears of inflation and worry that the Fed would become more aggressive in raising rates, which was precipitated by a stronger-than-expected jobs report. Fundamentally, however, not much has changed as interest rates have gone up but from very low levels historically. Inflation has moved higher but this has been the end game of central bank monetary policy since 2009. The strategy by the Fed and other central bankers was to keep rates low in order to move the global economy away from the arms of deflation.
A bear market in stocks generally occurs when the economy is close to or in recession. In the present example, the U.S. economy is on the verge of breaking out of a long period of sub-par growth. Corporations are experiences top-line growth for the first time in many years and earnings are expanding at double digits. The fact is that economic growth remains robust with few signs that inflation is about to return to 1970’s type levels.
It is too soon to argue that the current decline in the stock market has run its course. The fact is, however, that pullbacks in ongoing bull markets are more often a healthy development as they help correct the speculative excesses and prolong the life of the bull market.
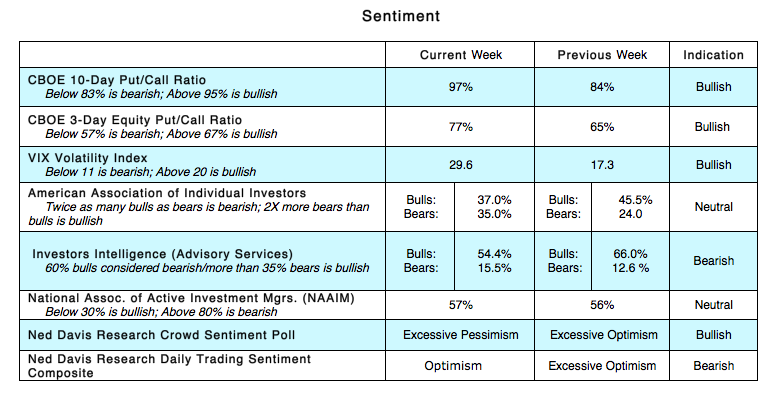
Technical factors have improved and offer some positive clues that the correction may be entering the final phase. The overbought and overbelieved conditions that preceded the decline have reversed. The percentage of stocks within the S&P 500 that are trading above their 50-day moving average plunged from 82% to 18% suggesting a deep oversold condition. Sentiment indicators, that were first to point to the potential of a market sell-off, have reversed. This is seen in several areas including the explosion in the demand for put options last week particularly on Friday when the CBOE put/call ratio soared to 130%. This helped push the 10-day CBOE put/call ratio into the bullish zone from bearish last week. The survey from the American Association of Individual Investors (AAII) and the report from Investors Intelligence (II) last week show a large contraction in the bullish camps. Using contrary opinion, this is a favorable development.
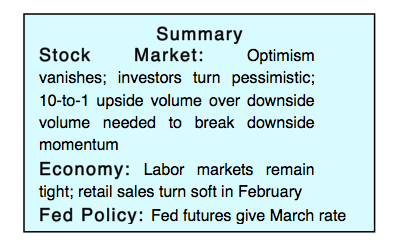
The bottom line is that fundamentally we are experiencing rising corporate profits and robust economic growth. Technically, there is a more positive backdrop this week in terms of investor sentiment and the oversold market. The key is for momentum to change to the upside to offer confidence that the decline has run its course. The past two-weeks have witnessed two sessions where downside volume exceeded upside volume by a ratio of 10-to-1 or more. Before the all-clear signal can be issued, we would need to see two sessions where upside volume exceeds downside volume by a ratio of 10-to-1 or more.
Twitter: @WillieDelwiche
Any opinions expressed herein are solely those of the author, and do not in any way represent the views or opinions of any other person or entity.


 Pressuring Lower Price Support")

