As we approach the turn of the year, precious metals appear to be at a decision point. In this article we look at two scenarios for the SPDR Gold Trust ETF (NYSEArca: GLD).
Our deflationary outlook for the U.S. Dollar has us favoring a bearish Elliott wave count for gold futures, but there’s a support level nearby that needs to break as confirmation.
The alternative scenario is mildly bullish. Here we examine both cases and provide some further discussion on how the two scenarios may play out.
Gold ETF (GLD) Nearing A Decision Point
Our latest newsletter focuses on some additional charts with more detail for gold futures and gold mining stocks. Request your free copy of the newsletter here, and note our special discount offer available this month on our premium subscription products.
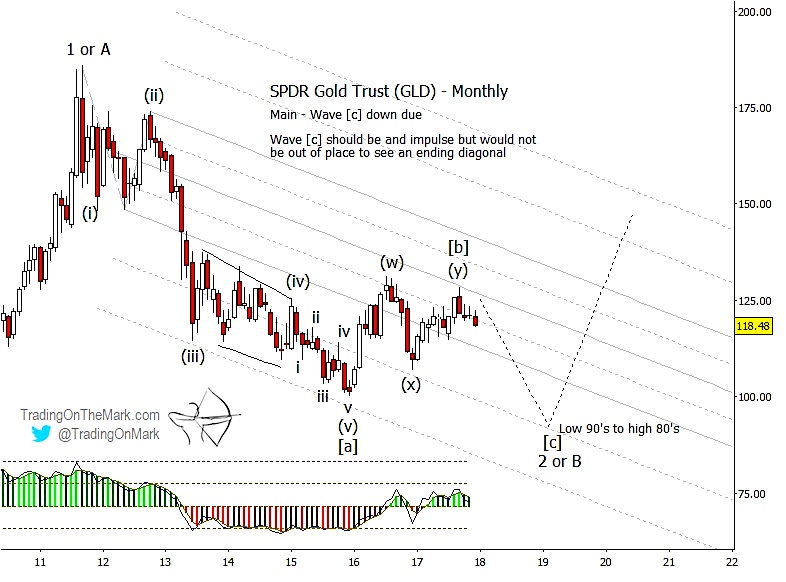
Primary, bearish scenario
GLD’s decline from its 2011 high has acted in some ways as a five-wave impulse should. In particular the rapid decline between 2012 an 2013 has the characteristics of a third wave — the central and strongest part of an impulsive move. Since an impulsive wave never exists in isolation, its presence can serve as a landmark and guide for traders navigating the moves that come afterward.
Seeing a five-wave move down from 2011 to 2015, followed by a three-wave correction up in 2016 and 2017, prompts us to watch for another strong declining move to balance the first downward impulse. The overall structure can be labeled as downward wave [a], upward wave [b] and the expected downward wave [c].
ALSO READ: Gold Miners (GDX) Head Lower As Trading Turns Bearish
Based on channel geometry for GLD as well as cycles analysis for the corresponding futures chart (not shown), a rough target zone for downward wave [c] is expected to be in the low 90s to high 80s — a decline of approximately 25% from the current price.
Note that the adaptive CCI momentum indicator is testing its zero line after having been slightly positive for a year. A break beneath the line would signal increased downward momentum, which would be consistent with price accelerating downward after breaking through nearby support.
If you don’t mind waiting, GLD’s and gold’s eventual decline into their support areas could represent an excellent value buy a few years hence.
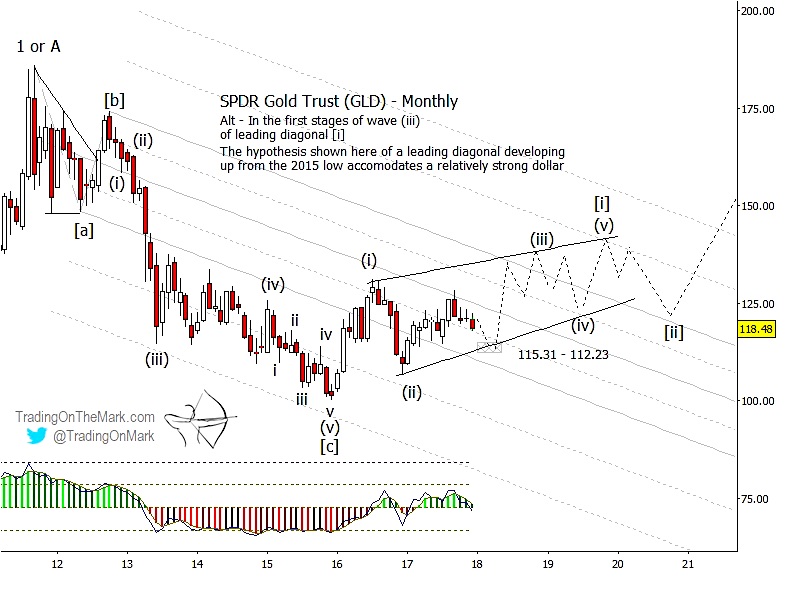
Alternate, bullish scenario
If price fails to decline convincingly beneath the nearby support area that ranges from 115.31 to 112.23, then a mildly bullish scenario remains possible. However it may not be an easy scenario to trade.
If an advance is to continue from near the present area, that would suggest that the series of choppy three-wave moves on the chart since 2016 represents the start of a rising diagonal pattern. That kind of sideways-upward drift could represent a balance of Dollar-deflationary forces vs. the desire to see precious metals as a safe harbor for wealth.
We will fine-tune the bullish scenario and develop specific targets if signals start to show the bearish case isn’t working.
Thanks for reading!
Twitter: @TradingOnMark
No position in any of the mentioned securities at the time of publication. Any opinions expressed herein are solely those of the author, and do not in any way represent the views or opinions of any other person or entity.

 Vying For Stock Market Leadership Role")
 Current Price Analysis and Future Considerations")

 Current Price Analysis and Future Considerations")
 Vying For Stock Market Leadership Role")
