The Emerging Markets ETF (EEM) and stocks have performed very well over the past year.
In fact, EEM is up nearly 30 percent over the last year, outperforming the broad market.
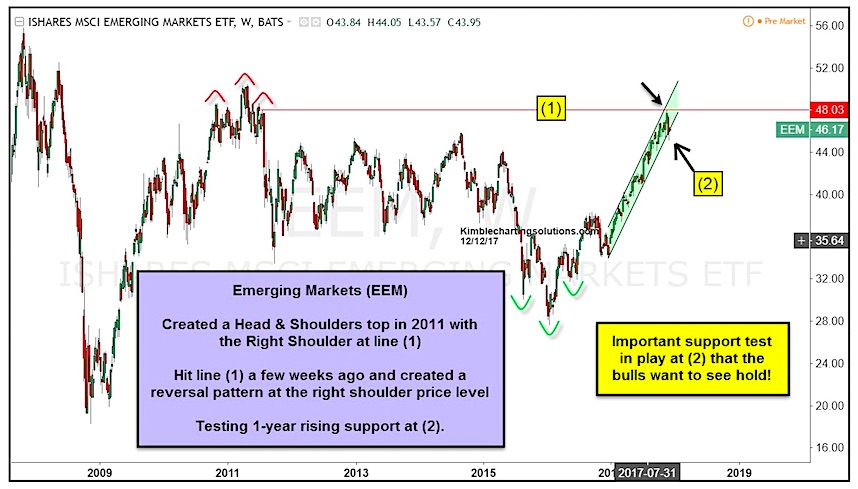
So what’s to worry about with Emerging Markets, right? Watch that price reversal!
The move higher off the January 2016 bottom has been steep… but the latest “leg” of this advance from the December 2016 low has been even steeper! EEM “ran” into key price resistance at point [1] on the chart below – the same price level of the ominous right shoulder back in 2011 – and saw a price reversal. The Emerging Markets ETF has moved lower since and is now testing steep uptrend support line at point [2].
To be sure, the move higher has been profitable and still bullish. BUT if this reversal carried price lower yet (breaking support), it could lead to a deeper correction.
So stay tuned!
Emerging Market ETF (EEM) Chart – At Key Price Resistance!
Twitter: @KimbleCharting
Any opinions expressed herein are solely those of the author, and do not in any way represent the views or opinions of any other person or entity.


