The S&P 500 Index (INDEXSP:.INX) declined -0.13% this past week with Friday’s close coming in at 2,578.85.
The index traded as low as 2,557.85 on Wednesday, and as high as 2,590.09 on Thursday, before finishing the week with a lazy “inside day” on Friday.
While most were aware that the S&P 500’s 8-week winning streak came to an end with the week ending 11/10, most were unaware that it still included a higher high and higher low than the week prior. And since the definition of any uptrend trend over any timeframe is higher highs and higher lows, this pushed our uptrend’s winning streak to 9 consecutive weeks… until last week.
Naturally, this past week catches my attention, since our streak of weekly higher highs and lows failed to make it to 10. “Finally!” scream the Bears.
S&P 500 Index – Weekly Chart
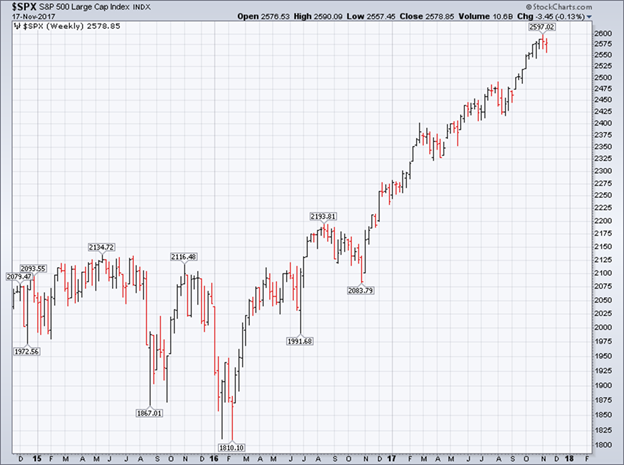
We had a hunch this would be the case based on last week ending on a sour note. In my Weekly Market Update from Sunday 11/12, which you can read by clicking here, I wrote:
“Should the index not hurdle 2,597.02 over the week ahead, it’s likely that it trades below 2,566.33. It’s in this scenario where we envision the long-awaited, healthy, pullback toward the 50-day simple moving average, which is currently 2,536.02 and ascending. A trade down toward ~2,540 would likely create “oversold” conditions across shorter-term time frames, reset daily momentum back to early October, and help refuel the S&P 500’s gas tank for a strong sprint across 2017’s finish line. This remains our most preferred scenario.”
We never made it to the 50-day simple moving average, but we reversed higher anyway, leaving most everyone, myself included, asking themselves the question that so perfectly captures 2017:
“Is that it? That’s the entirety of the pullback?”
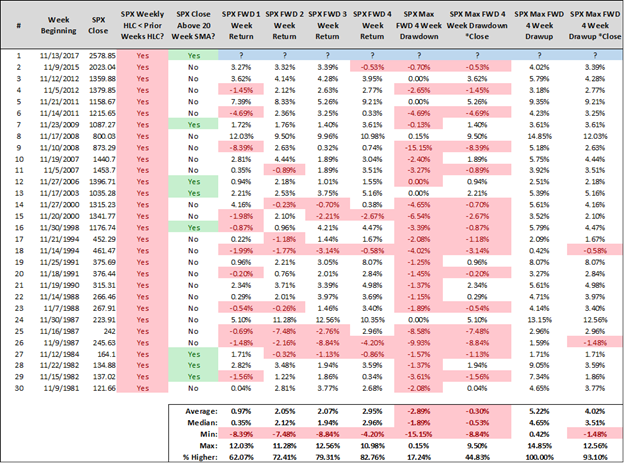
If history is any guide, which is always a big if since we live in unprecedented times, November weakness was a gift and it’s now behind us. Since 1980, there’s 29 prior weeks in November that ended with a lower high, low, and close, than the week prior (this week marks #30). Of those prior 29 samples, 23 of them saw the S&P 500 close higher 3 weeks later while 24 were higher 4 weeks later. Median returns over the forward 3 and 4 weeks record as 1.94% and 2.96% respectively. More recently, 11 of the last 12 samples were higher 2 weeks out, while the last 12 samples have all been higher 13 weeks out. Overlapping samples certainly play a role here, but the point still remains.
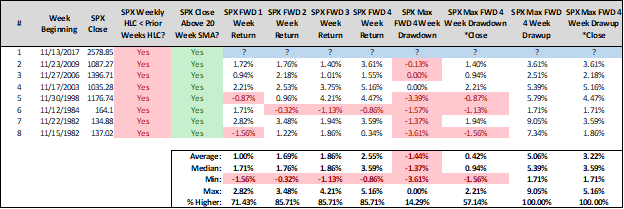
If we add trend criteria, such as identifying only those samples where the price of the S&P 500 closed the week above its 20 week simple moving average, we eliminate the few banana peels from the data set and avoid comparing samples during downtrends to those during uptrends. There’s only 7 prior samples of weeks in November that ended with a lower high, low, and close than the week prior while also closing above the 20 week simple moving average. The S&P 500’s returns over the forward 2, 3, and 4 weeks is higher 6 of 7 samples for median returns of 1.76%, 1.86%, and 3.79% respectively.
In summary, unless this time is different, we’re onward and upward from here. While nothing I share is consistently predictive or a holy grail, that doesn’t prevent me from identifying the primary trend of today, which is clearly up or “Bullish”. And since the primary trend of today is the most likely trend of tomorrow, a glass half full approach with regard to your trading and investing decisions is prudent, defensible, and intelligent. We’re entering a favorable period of the calendar year with a massive tailwind blowing behind the S&P 500’s back. Market participants remain eager buyers of equities on any and all weakness, treating a -1.5% decline from all-time highs as a sale of a lifetime this week. Investing for success asks us to do our best in knowing when to hold em, and when to fold em. My work suggests were probably best served holding em the remainder of 2017.
Twitter: @SJD10304
The author may hold positions in related securities at the time of publication. Any opinions expressed herein are solely those of the author, and do not in any way represent the views or opinions of any other person or entity.

")
 Consolidation: Breakout Next?")