In July of 2016 I discussed how the chart patterns were suggesting the popular 20 Year+ Treasury Bond ETF (NASDAQ:TLT) was about to hit stiff resistance and put in a tradable top.
This area has thus far proven to be the all-time high for this ETF.
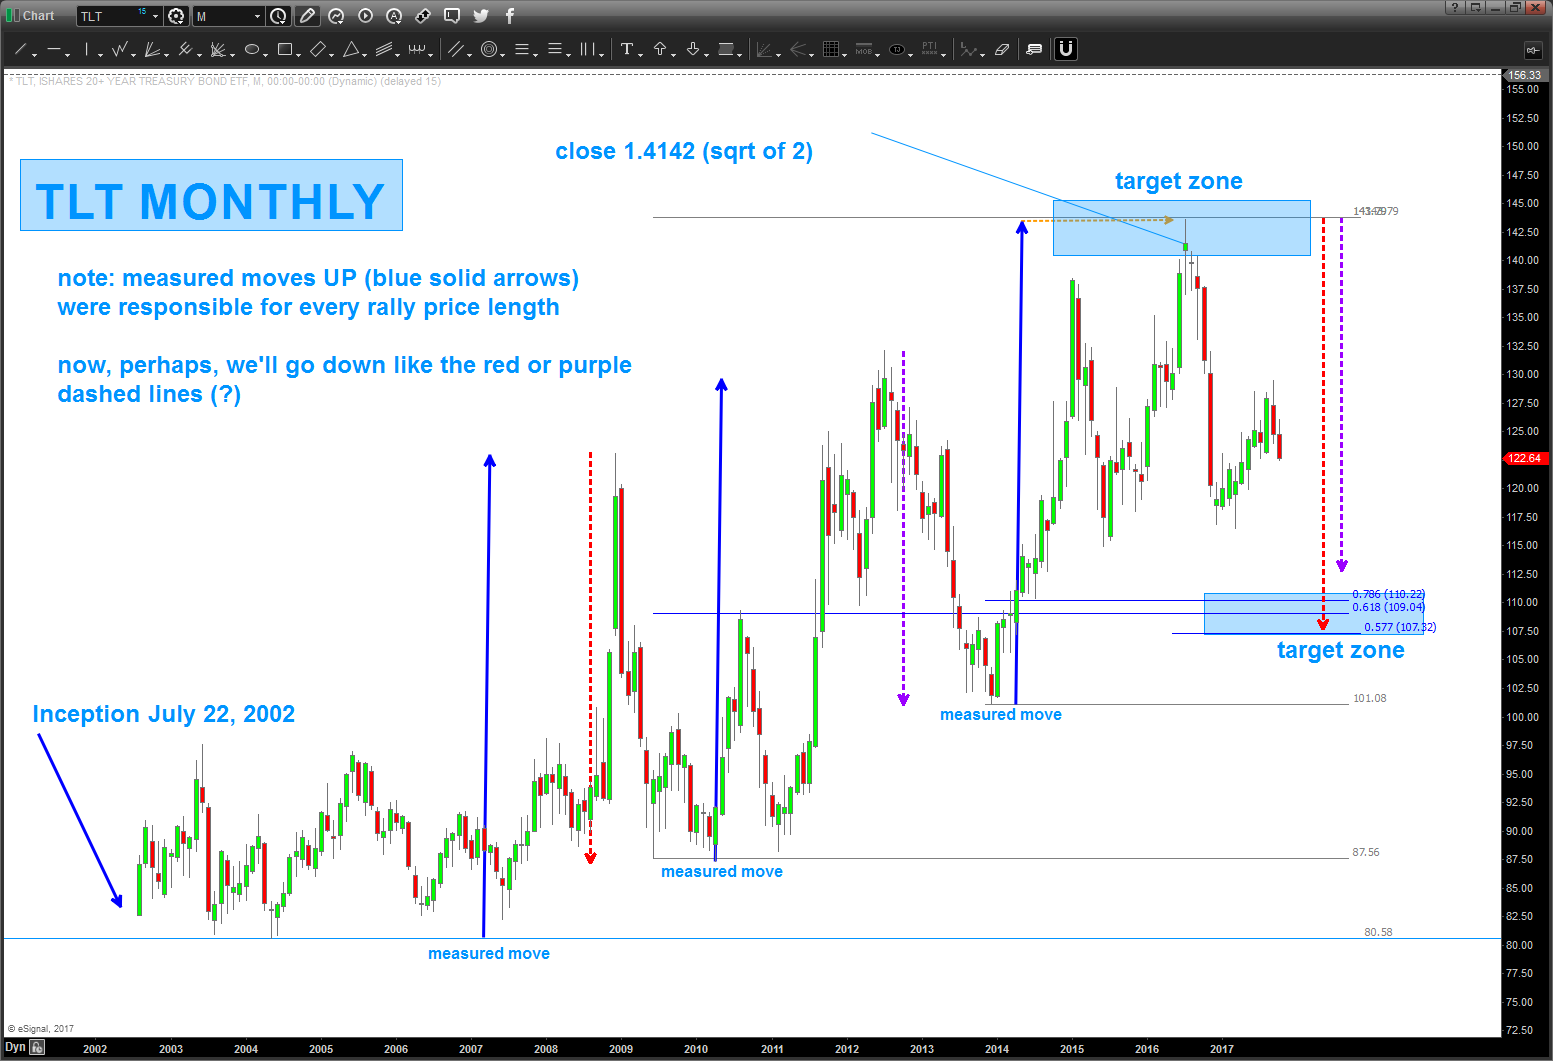
After the TLT topped in 2016, it headed lower in a hurry… making it hard for longs to get out. It wasn’t until it became extremely oversold earlier this year that a bounce ensued.
TLT Treasury Bond ETF: Lower Price Targets Ahead?
That bounce looks to be on shaky ground… and now the entire bond complex is at a critical juncture.
Will it roll over and target the lower price targets in chart above? Or will it pivot higher for one more thrust?
Perhaps the Short Treasury Bond ETF (TBT) Can Help Answer That Question
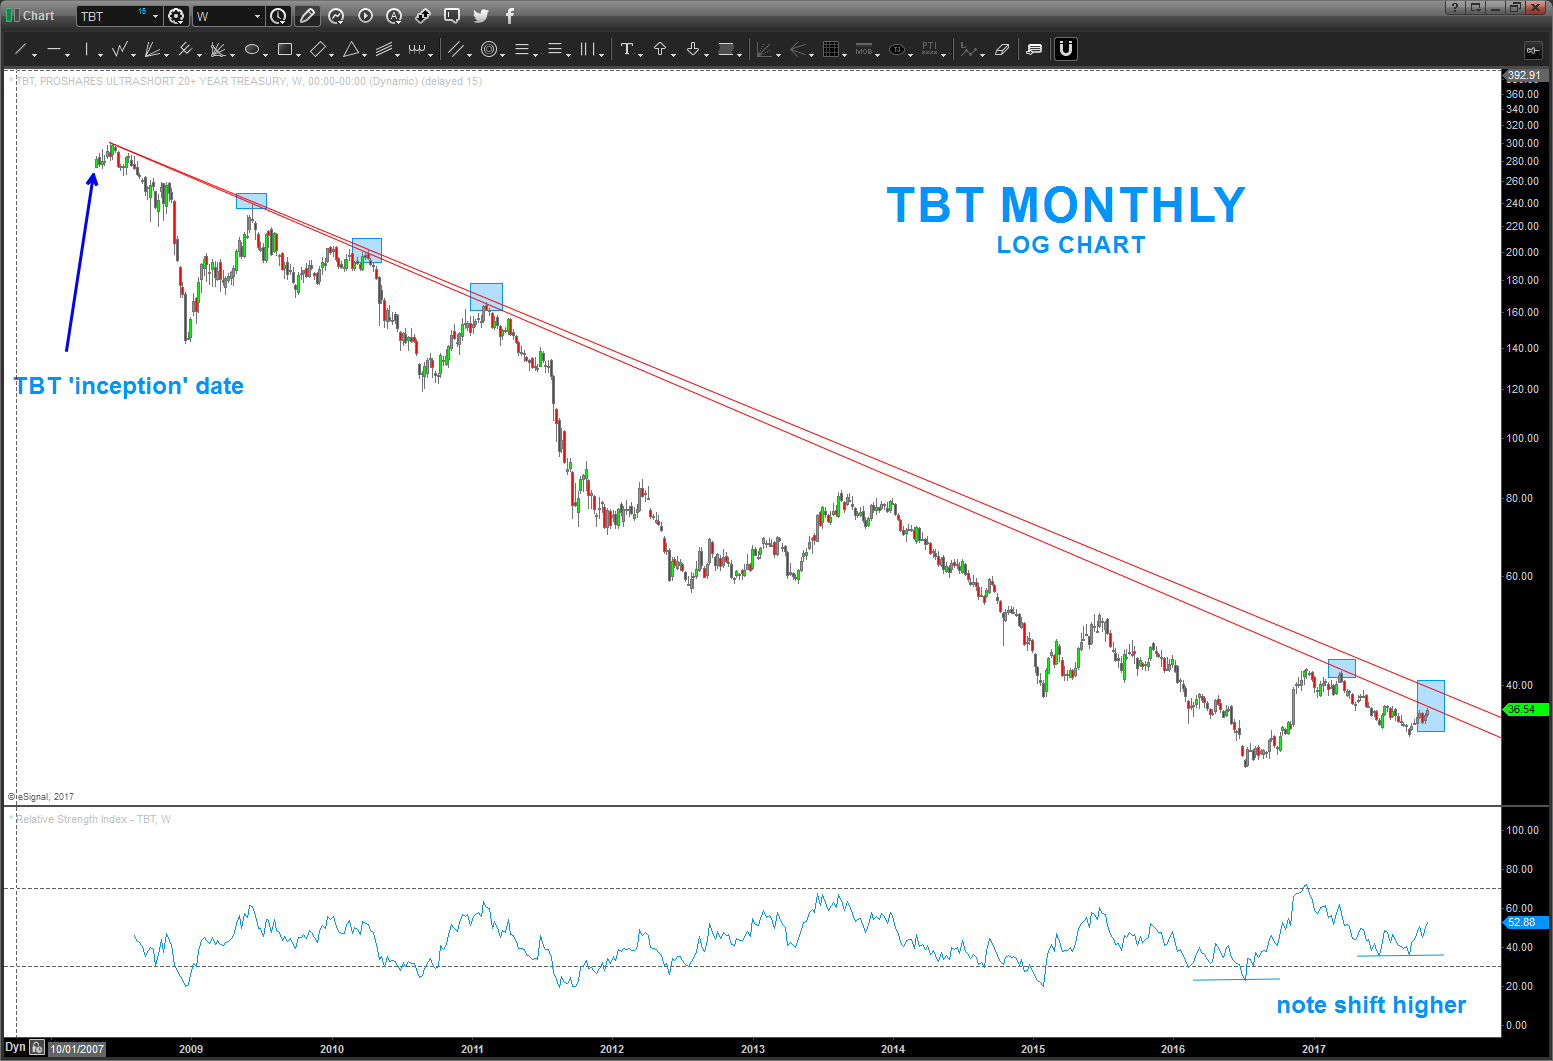
I’m going to focus my attention now on the ProShares Ultrashort 20 Year Treasury Bond ETF (NYSEARCA:TBT). As those who follow me know, I like to use long term LOG trend lines. When these are broken to the up or downside, a trend change can prove to be imminent. The TBT is bets against the treasury bond complex, essentially the inverse of the TLT. However, it’s starting to show signs of a long term trend reversal. Note below:
- Since inception, the TBT has NEVER close (weekly/monthly) above this downtrend log trend line. It’s testing the lower trend line right now. I would consider both ‘areas’ as key resistance.
If we can get a weekly/monthly close above the highlighted area then the potential for a very important top in the bond complex is real.
- Note the shift of support on the RSI.
While still early, when the overall trend changes, you’ll find the monthly 14 period RSI will shift zones of support higher and zone of resistance higher (for a reversal of trend from down to up)
So, net-net, keep an eye on this key level for the TBT in the days/weeks ahead.
Twitter: @BartsCharts
Author does not have a position in mentioned securities at the time of publication. Any opinions expressed herein are solely those of the author, and do not in any way represent the views or opinions of any other person or entity.

 Set For Revival?")


 Set For Revival?")