The following is a recap of the recent Commitment of Traders Report (COT) released by the CFTC (Commodity Futures Trading Commission) looking at Commitment of Traders data and commodity futures positions of non-commercial holdings as of April 18.
Note that the change in COT report data is week-over-week. Excerpts of this blog post also appear on Paban’s blog.
3 Commitment of Traders report charts kooking at spec futures positions in key commodities like Gold and Crude Oil, along with the US Dollar.
CRUDE OIL
Currently net long 483.3k, up 26.3k.
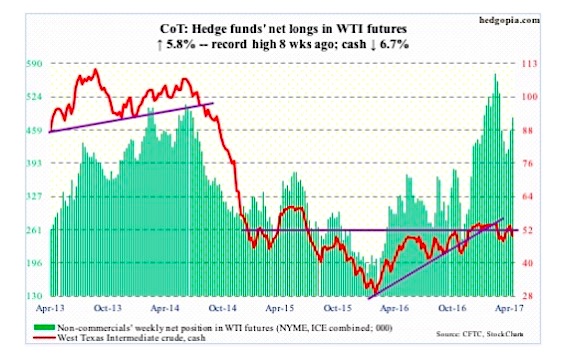
The latest EIA report out Wednesday was not that bad, but spot West Texas Intermediate crude ($49.62) proceeded to lose 3.8 percent in that session, losing support at $51-$52 as well as the 50-day moving average. At Friday’s low, it was merely 0.5 percent from testing the 200-day.
This was preceded by a 13-session (from intraday low to high), 14-plus percent rally through April 12. Digestion was only natural. And it is taking place by giving up a good portion of these gains.
Near-term, risk is of a test of support at $47.
In the week ended April 14, the EIA report showed, U.S. crude stocks fell one million barrels to 532.3 million barrels. This is the second straight week-over-week drop since reaching a record 535.5 million barrels two weeks ago.
Gasoline and distillate stocks went separate ways, with the former rising 1.5 million barrels to 237.7 million barrels and the latter dropping two million barrels to 148.3 million barrels.
Refinery utilization rose 1.9 percentage points to 92.9 percent – a 14-week high.
Crude imports fell – by 68,000 barrels per day to 7.8 million b/d. Production, on the other hand, continued to inch higher – up 17,000 b/d to 9.3 mb/d. Since OPEC reached a cutback agreement late November last year, U.S. production has gone up by north of 500,000 b/d.
GOLD
Currently net long 195.8k, up 23.1k.
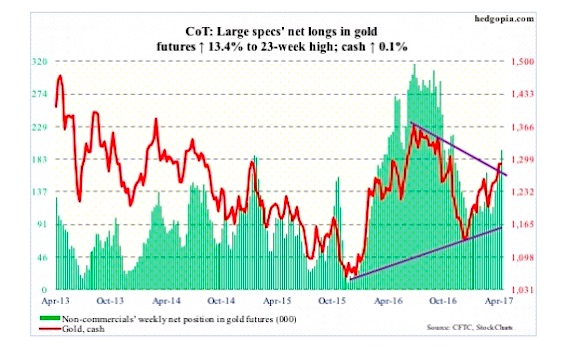
There was resistance on the cash at the $1,300 level. Monday, in a long-legged doji session the metal retreated after rallying to $1,297.4 – preceded by a doji in the prior session.
From March 10 through that high, gold ($1,289.1) added just north of $100. The daily chart in particular remains overbought. For its own good, the metal probably needs to test the 200-day moving average ($1,259.38). For a month and a half beginning late February, the average repelled several breakout attempts, so is bound to stage a tug of war between bulls and bears.
The rising 50-day rests at $1,245.58.
US DOLLAR INDEX
Currently net long 43.4k, down 898.
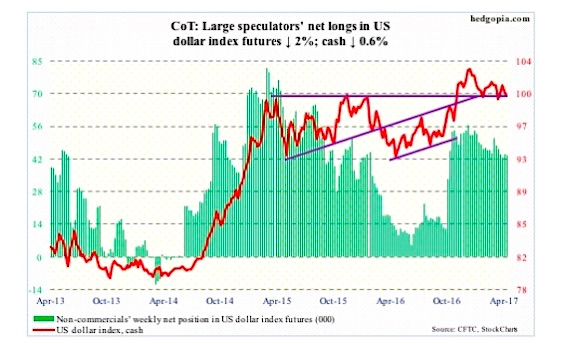
The neckline of a head-and-shoulders formation on the cash was just about tested Thursday when it hit 99.29. The index has been under pressure since rallying to 101.27 to kiss the upper Bollinger band eight sessions ago.
In the days ahead, worse, the dollar index drops to test the 200-day moving average (98.91), which also approximates the aforementioned neckline – a must-hold, and likely does not give way. Daily conditions are oversold.
Thanks for reading.
Twitter: @hedgopia
Author may hold a position in mentioned securities at the time of publication. Any opinions expressed herein are solely those of the author, and do not in any way represent the views or opinions of any other person or entity.


