CarMax, Inc. (NYSE:KMX) offers a broad selection of high-quality used autos and related products and services at “low, no-haggle prices” using a customer-centric sales process in attractive sales facilities.
Its strategy is to “revolutionize” the used-auto retailing market by addressing the major sources of customer dissatisfaction with traditional auto retailers. The company operates in two segments, CarMax Sales Operations and CarMax Auto Finance. As of 2016, the company operated 158 stores in 37 states.
Based on industry data, the used auto market consists of approximately 40 million units. An estimated 22 million are between 0-years to 10-years old, the age segment in which CarMax operates. In FY 2016 CarMax sold 619, 936 retail units, effectively capturing 2.8% of its target market. CarMax also sold 394,437 wholesale units, capturing 3.9% of the wholesale-auction market. Based upon these metrics, CarMax certainly has a large growth opportunity available to it.
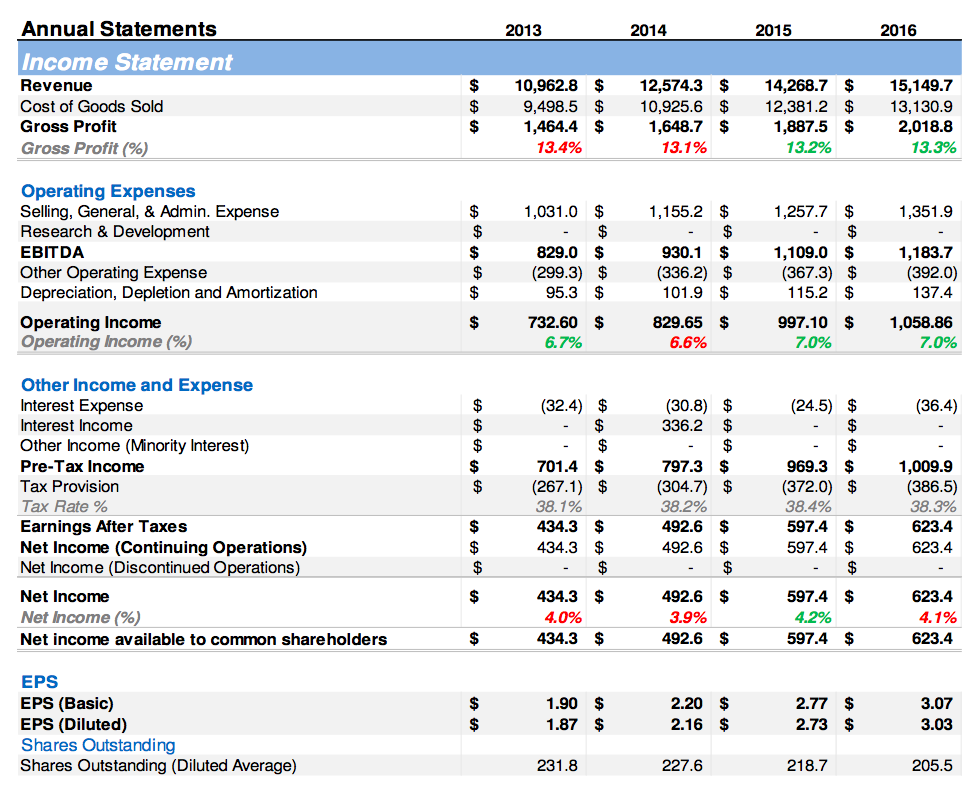
Since 2013, revenues have increased at a compounded annual growth rate (CAGR) of 11.4%. Net income has increased at a 12.8% CAGR over the same time-period. The logical conclusion is that CarMax Management is a role-model of efficiency, as SG&A expense has increased at only a 9.5% CAGR.
Market participants have certainly rewarded CarMax stock since FY 2013. The stock price has appreciated from $30.69, trading in a range of $24.83 to $75.40. The stock closed last Friday (March 24) at $59.60, a CAGR of 17.7%.
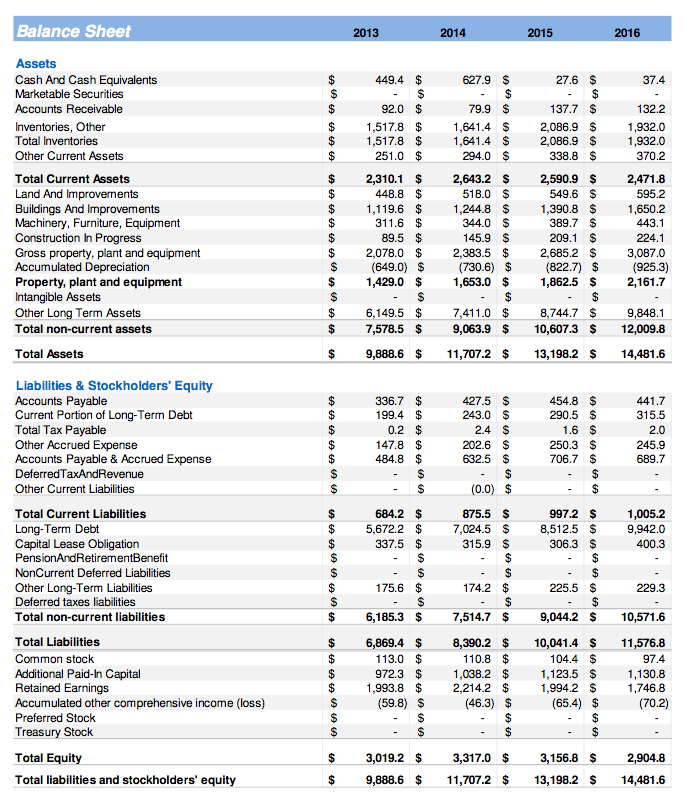
In FY 2016 CarMax Auto Finance (CAF) financed 42.8% of its total retail units sold, an increase from FY 2013’s 39.4%. Since 2014, CAF also finances a growing number of sub-prime borrowers. Characteristics of total loans (weighted average) include: Contract Rate: 7.3%, Credit Score: 702, Loan-To-Value: 94.6%, Term: 65.9 months. CarMax carried $9.5B of these receivables on its FY 2016 balance sheet; 327.5% of total equity. (from p.21 of the 10-K, “auto loan receivables, net”; gurufocus rolls them into “other long-term assets”.)
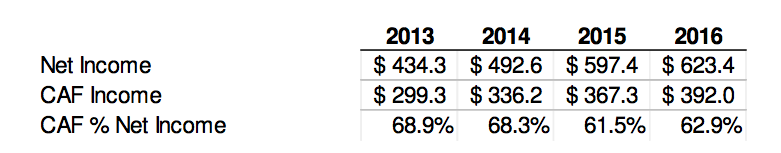
CarMax has set aside only 1% of its receivables balance as an allowance for future credit losses. Recovery rates ranged from 42% to 60%, with a realized average of 51.2% in FY 2016. As a point of comparison, in FY 2009, realized credit losses equaled 1.74% and the realized average recovery rate equaled 44%. CarMax relies upon CAF for over 60% of its net income. Financial data sourced from GuruFocus.com and the CarMax 10-K.
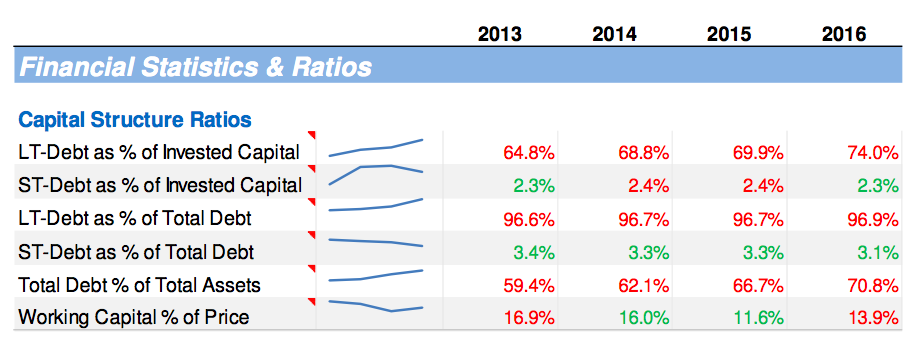
CarMax commenced (and is continuing) a share repurchase program in 2013. To-date, shares outstanding (diluted average) have declined by 26.3 million, or 11.3%. As a direct consequence, although net income has increased at a 12.8% CAGR, earnings per share have increased at a 17.5% CAGR. As can be seen in the following table, the capital structure of CarMax is highly levered. Financial data sourced from GuruFocus.com and the CarMax 10-K.
Management has been leveraging the company up into, arguably, the peak of this cycle regarding auto sales, if not the broader economy. In the process, they have been compensated handsomely through equity sales. From 2013 through January 2017, management has sold $215 million in stock. The CEO, Thomas J. Folliard, has personally sold $84 million. Management actions speak louder than words.
Insider data from gurufocus.com.
In summary, I believe the business model of CarMax has thrived upon (was saved by) the extraordinary monetary policy of the Federal Reserve. Increasing flows of cheap credit to borrowers of average creditworthiness, on average, and expansion into sub-prime lending; funded by yield-seeking investors starved of current-income. In addition, management has made the conscious decision to further leverage the company by issuing debt to repurchase shares. As long as the flow of cheap credit continues, business is great. However, …
In my opinion, Investors in the equity (and debt) of CarMax should be concerned with how their investment performs during the second half of this cycle. Positive economic momentum has turned uncertain and the Federal Reserve is raising interest rates. Delinquencies of sub-prime auto loans stand at 4.51%, nearing their crisis-peak of 4.69%. Delinquency rates on CarMax receivables peaked in 2010 at 3.24%, as of FY 2016 they totaled 2.74%. Recall, auto-loan receivables account for 327.5% of CarMax balance sheet equity.
A wise man once said, “Skate to where the puck will be.” In 2008, that place was 90% lower from the current price.
Check out more of my research over at Global Technical Analysis. Thanks for reading.
Twitter: @Techs_Global
Any opinions expressed herein are solely those of the author, and do not in any way represent the views or opinions of any other person or entity.
The author doesn’t not have a position in the mentioned securities at the time of publication.
 Set For Revival?")


 Set For Revival?")