The two questions I’ve been asked most often lately are, “What’s behind the soybean rally? And is it sustainable?”
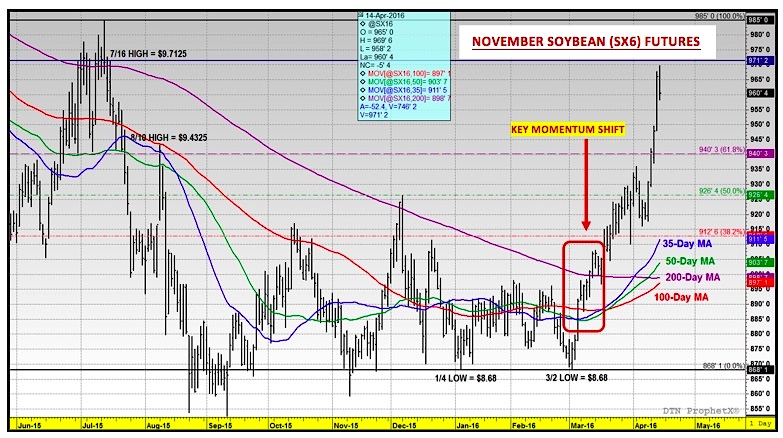
The charts show that since November soybean futures established a key double-bottom on March 2nd at $8.68 per bushel, soybean futures have done nothing but trend higher. The soybean rally has since culminated with SX6 scoring a new 2016 high of $9.69 ¾ on April 14th, which is the highest SX6 has traded since July 16th, 2015.
That said what have been the key supportive elements underlying the rally in soybeans? Let’s review:
- Technical Momentum: When November soybean futures broke to and held the calendar year day low of $8.68 per bushel on March 2nd, there was almost an immediate momentum shift in prices. Prior to that for an extended period of time (from approximately 12/28/2015 through 3/3/2016) November soybeans had traded in a very narrow range of 25-cents per bushel ($8.89 to $8.64). This resulted in the 35, 50, and 100-day moving averages in SX6 all converging on top of each other. This in turn created the possibility for November soybean futures to close over all 3 key moving averages in one trading session if SX6 could muster just one sharply higher close. That’s exactly what happened on March 4th when November soybean futures closed up 13-cents per bushel at $8.91, triggering the soybean rally. Just 4 full trading sessions later November soybeans would add the 200-day moving average to that list of key resistance levels now penetrated. The end result was a major technical momentum shift in futures values to the upside.
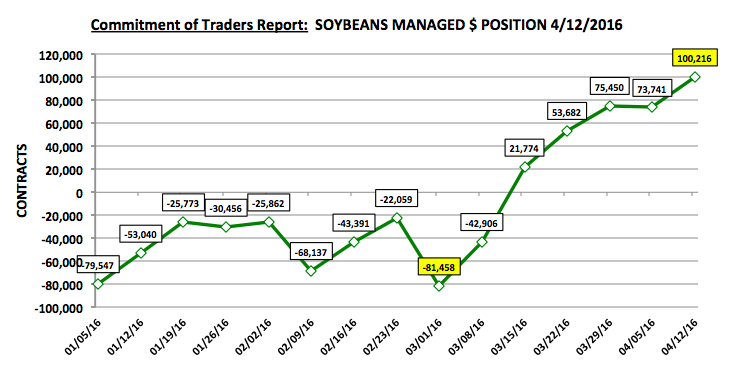
- Managed Money $ Movement: As of the market close on March 1st, 2016 the Managed Money position in soybeans was a net short -81,458 contracts. The following day November soybean futures dipped to the aforementioned calendar year low of $8.68 per bushel. However from 3/1 through 3/15 money managers switched gears completely, buying +103,232 contracts, aiding the soybean rally. The timing of these buys coincided perfectly with the push in November soybean futures above the 35, 50, 100, and 200-day moving averages from 3/4 through 3/10. By April 12th the Managed Money position in soybeans had swung full circle to a net long of +100,216 contracts (graph on page 2). On April 14th November soybean futures traded up to their current 2016 day high of $9.69 ¾ per bushel.
Therefore it’s apparent this current $1.01 ¾ per bushel soybean rally (via November soybean futures) has been primarily a function of a major technical momentum shift in price coupled with waves of consistent and sizable buying from Money Managers.
That said has there been a change in the underlying market fundamentals that has also played a part in propelling soybean futures higher? I would argue “no” for the following reasons:
- The top 3 largest soybean producers and exporters in the world are the United States, Brazil, and Argentina. Collectively they represent 83% of world soybean production and 88% of world soybean exports. In 2015/16 those 3 countries produced a record 265.9 MMT of soybeans. Therefore, there is no current shortage of available soybean supplies from the “Big 3.” They are more than capable of meeting global import demand even with China forecasted to import 83 MMT of soybeans in 2015/16.
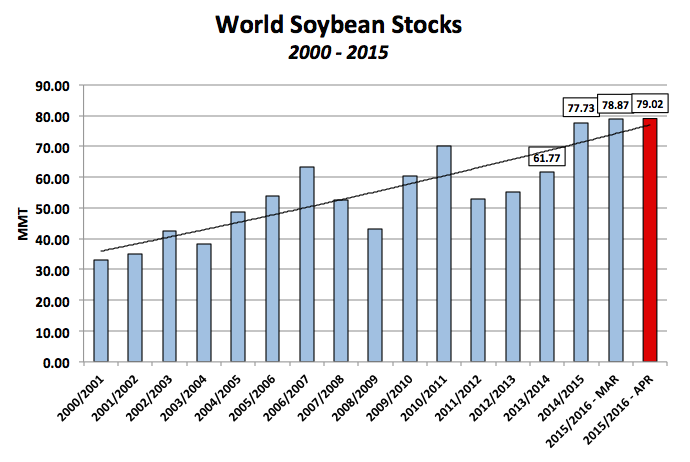
- World soybean ending stocks for 2015/16 were estimated at a record high of 79.0 MMT in the April WASDE report, which is 1.3 MMT higher than a year ago and 17.2 MMT above 2013/14 (61.77 MMT). The inference then being that world soybean production continues to rise faster than demand, which is allowing global soybean inventories to increase to historic levels.
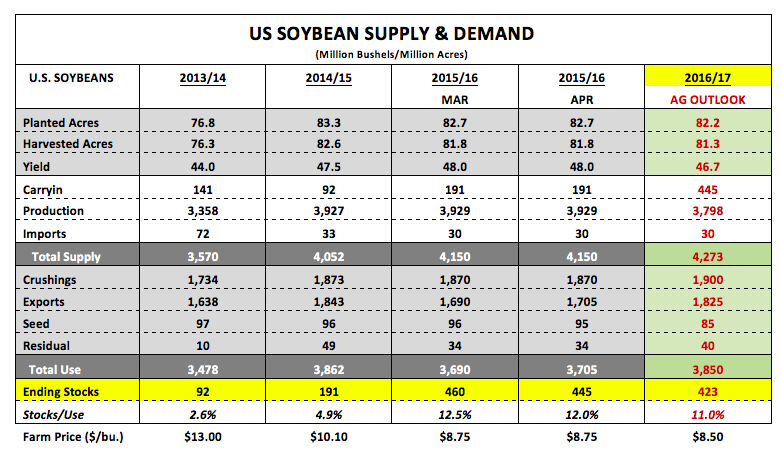
- U.S. soybean ending stocks for 2015/16 were estimated at 445 million bushels, which is 254 million bushels higher than a year ago and compares to the 5-year average of 162 million. In fact this is the largest U.S. soybean carryout since 2006/07.
- The USDA’s March 2016 U.S. soybeans planting intentions forecast of 82.2 million acres, although slightly lower than a year ago, still represents the 3rd highest soybean acreage base in history. Furthermore when this acreage figure is applied to the USDA’s 2016/17 Ag Outlook yield (46.7 bpa) and total demand (3,850 million bushels) projections from February, the new-crop U.S. soybean carryout pencils back at a very comfortable 423 million bushels.
Contrarians will immediately gravitate toward perceived weather concerns in Brazil and/or Argentina, as well as, the potential for a La Nina weather event in the U.S. the 2nd half of this year. However all such arguments I view as weak and reactive justifications in trying to fundamentally defend this $1 rally in soybean futures. That’s not to dismiss the potential yield impact on U.S. crops this summer if La Nina is a major issue; however that necessitates a July/August price response, not an April price response.
What does this mean for November soybean futures prices going forward? I believe as soon as the market shows any small signs or suggestions of exhaustion to the upside, a steep downward correction in SX6 is possible (and if this happens corn futures are likely to follow). Money Managers will at some point look to reward the soybean rally (by selling out of their long positions), especially since it’s not backed by a compelling fundamental storyline. The 5, 10, and 30-year price seasonals in November soybean futures (page 5) do show that it’s not uncommon for futures values to trend higher into May; however the speed and acceleration of this current move is virtually unprecedented. The next level of key resistance is $9.71 ¼ per bushel…if that area holds next week I would expect to see the market start to roll over. However if Money Managers continue to defend the soybean rally and SX6 closes over $9.71 ¼ the next upside target would be the 7/14/15 high of $9.85. I continue to view this rally as a pricing opportunity for soybean producers.
Miscellaneous Charts
April 2016 WASDE Revisions with May 2016/17 Hypotheticals using Ag Outlook Estimates and March Planting Intentions:
World Soybean Stocks:
Thanks for reading.
Twitter: @MarcusLudtke
Author hedges corn futures and may have a position at the time of publication. Any opinions expressed herein are solely those of the author, and do not in any way represent the views or opinions of any other person or entity.
Data References:
- USDA United States Department of Ag
- EIA Energy Information Association
- NASS National Agricultural Statistics Service


 Set For Revival?")