After two big up days, several stock market indices are making new 2016 highs. The S&P 500 sits just below 2100, while the Dow Jones Industrial Average is just below 18,000.
Although the market appears to be extended (i.e. overbought), it also appears to be on the verge of a breakout above it recent downtrend lines. This is something that technical traders and investors are likely watching.
This breakout could lead to a full retest of the broad stock market indices all time highs.
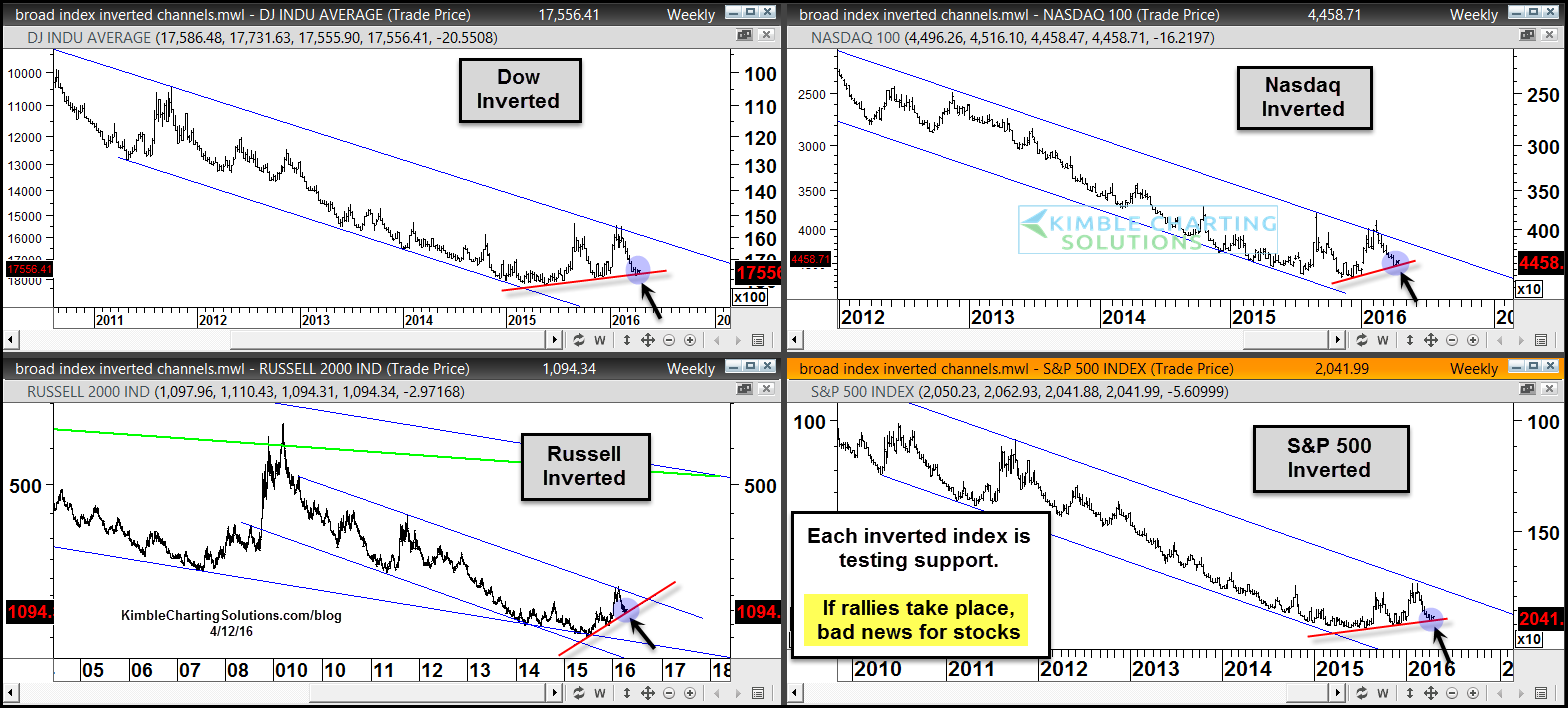
Below is a chart showing four of the major stock market indices. The chart was put together yesterday morning, so keep in mind that the markets are higher now (due to the big 2-day rally).
You’ll also note that the chart below is an INVERTED chart. I’ve shared multiple inverted charts here on See It Market (see them here). The main purpose is to get rid of our recency bias (and oft nature to be skeptical market turns). Add a few hundred points to the Dow Jones and 35 or so to the S&P 500 (due to the recent rally) and you can see how this trend line is undergoing a BIG test.
Inverted, it looks like a potential breakdown. Right side up, it would be a breakout.
Thanks for reading and have a great day.
More from Chris: Is the Euro Currency Ready For A Breakout?
Twitter: @KimbleCharting
The author has positions in related securities at the time of publication. Any opinions expressed herein are solely those of the author, and do not in any way represent the views or opinions of any other person or entity.


 Set For Revival?")


 Set For Revival?")
