The March 14 outlook for S&P 500 futures may have more to do with balancing the week ahead than the day ahead. This week is not only Fed week but also OPEX week (options expiration).
Buyers continue to prop price up at key tests of support.
Support is being tested after charts ran right into resistance lines on Friday and breached them before retracing. Momentum remains damp, suggesting that breaches to the north will not hold into levels above without retracement. 2017-2022 holds steady as the key target levels above for S&P 500 futures.
2002 -1997 now becomes the support area that buyers need to defend to keep the rally strong.
Momentum on the four hour chart is positive, suggesting that buyers will show up at key support levels. Daily charts continue to show price holding steady above the moving averages and momentum as trending positive, and still in positive territory- a clear signal to me that the power of momentum still sits with buyers as we sit near the top of the trading range. The key will be watching for technical divergence intraday and in longer cycles.
Shorter time frame momentum indicators are sloping down – but trend is holding. 2002 – 1997 is the support region to watch for sellers to test and for buyers to hold if this chart fails to move forward.
See today’s economic calendar with a rundown of releases.
THE RANGE OF THURSDAY’S MOTION
Crude Oil Futures (CL_F)
Crude Oil begins the morning with a definite bearish slant- but support levels hold currently. The buyers will have to hold the retest of 37.36 for buyers to get into their ultimate target of 40, in my mind, anyway. This chart feels very extended, but it seems clear that buyers are strengthening their foothold.
Today, the trading ranges for crude oil futures are between 37.6 and 38.98 –I expect the possibility for breaches on either side here is most likely. Big battleground exists between 37.48 and 37.85- buyers are likely to appear near 37.48.
Moving averages in crude oil show rising positive momentum on longer time frames, but a recent loss of key levels near 38.2 give sellers a bit more confidence that they can push the chart lower. Intraday support is steady at 37.03, but a failed retest there could significantly change the structure of this chart.
Intraday long trading setups on crude oil suggest a long off 38.42 positive retest, or 37.08 positive retest into 37.54, 37.7, 38.12, 38.38, 38.57, 38.7 and if buyers hold on, we’ll see 38.94 to potentially 39.6.
Intraday short trading setups suggest a short below a 37.7 failed retest with negative divergence, or the failed retest of 38.2 sends us back through targets at 37.94, 37.7, 37.12, 36.74, and back into familiar regions seen near 36.24, if sellers hang on.
E-mini S&P 500 Futures (ES_F)
Below is a S&P 500 futures chart with price support and resistance trading levels for today. Click to enlarge.
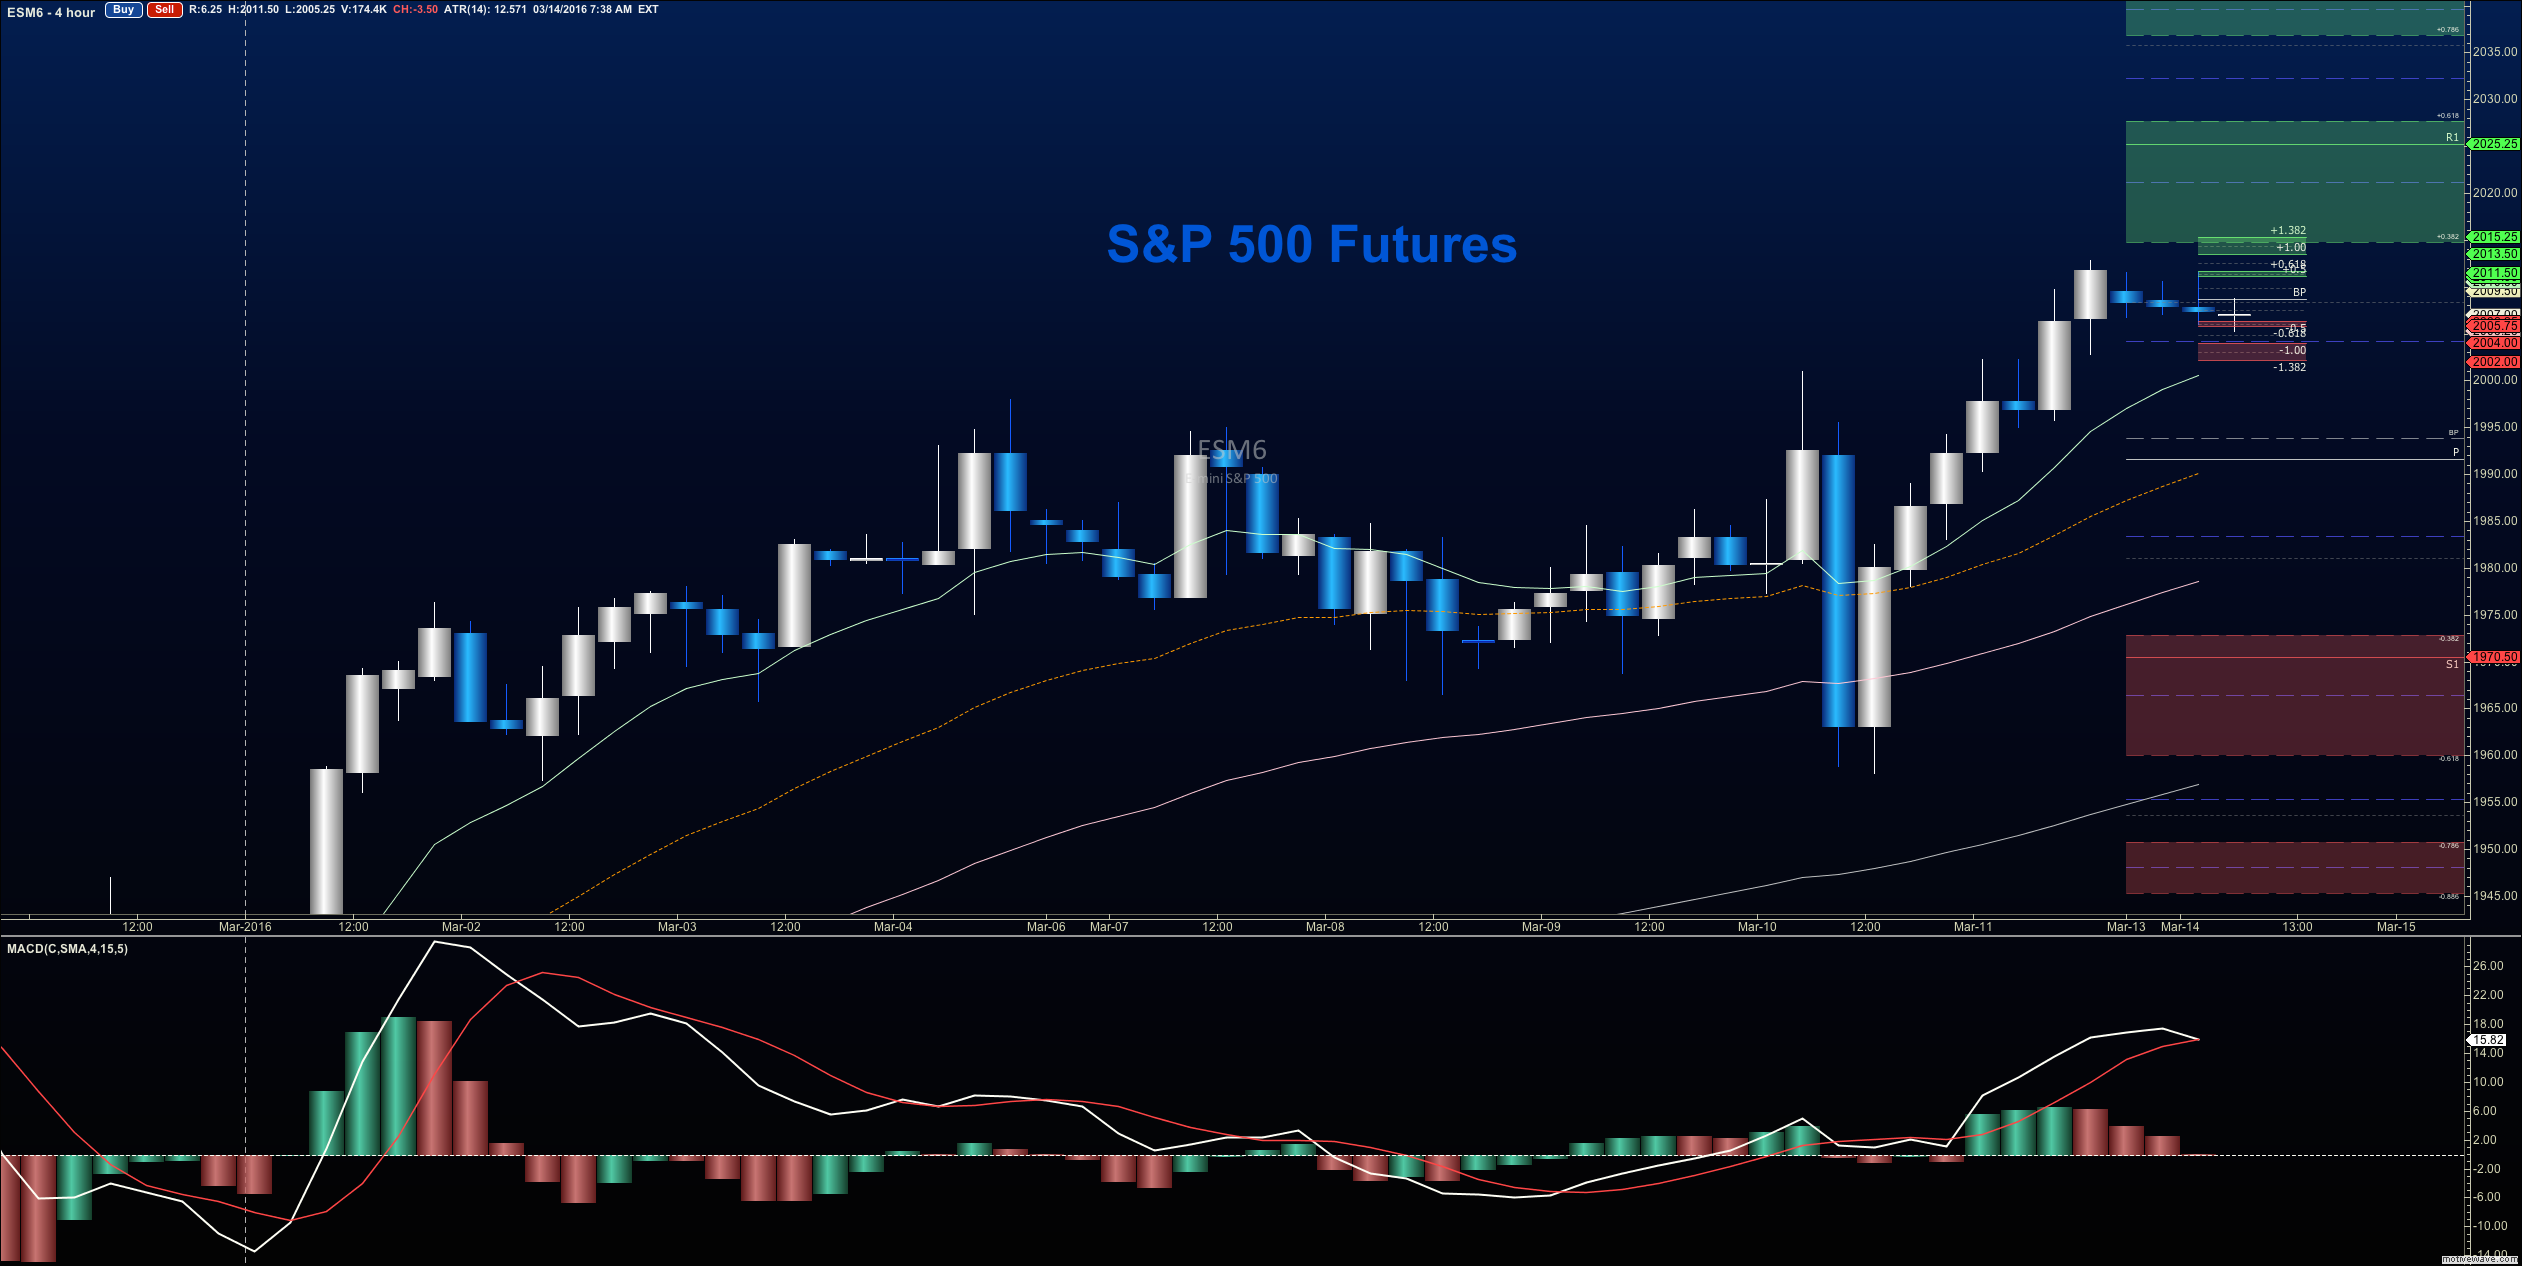
The outlook for S&P 500 futures on March 14 includes a reminder that sellers were rejected at resistance on Friday and buyers have not been able to force the chart back beyond 2011.25 thus far. Overhead supply remains strong, but momentum is mixed and flattening – it still won’t be easy for buyers to breach resistance and hold. It will be a grind north, it seems.
Upside motion on S&P 500 futures has the best setup on the positive retest of 2010.5 or a bounce off 2000.5 with positive momentum. I use the 30min to 1hr chart for the breach and retest mechanic. Targets from 2005 are 2007.5, 2010.5, 2012.25, and if we can catch a bid there, we could expand into 2017, 2021.25 and 2023.5. The next resistance tests remain between 2011-2015.75, then 2021-2025. Watch the higher lows to keep you on the right side of the long trade. Charts are firming up, but expect pullbacks to find buyers – see the fib zones for support regions.
Downside motion opens below the failed retest of 2005 or at the failed retest of 2011.25 with negative divergence – but really watch for the higher lows there- the higher lows will signal that your short is ill positioned. Retracement into lower levels from 2005 gives us the targets 2002.25, 2000.5, 1999.25, 1994.25, 1991.5, 1987.75, 1984.5, 1981.5, 1974.75, 1971.25, 1969.25 and perhaps 1964.5 if selling really takes hold, but that seems quite unlikely at this point in the day.
If you’re interested in the live trading room, it is now primarily stock market futures content, though we do track heavily traded stocks and their likely daily trajectories as well – we begin at 9am with a morning report and likely chart movements along with trade setups for the day.
As long as traders remain aware of support and resistance levels, risk can be very adequately managed to play in either direction as bottom picking remains a behavior pattern that is developing with value buyers and speculative traders.
Thanks for reading.
Twitter: @AnneMarieTrades
The author trades stock market futures every day and may have a position in mentioned securities at the time of publication. Any opinions expressed herein are solely those of the author, and do not in any way represent the views or opinions of any other person or entity.


")
