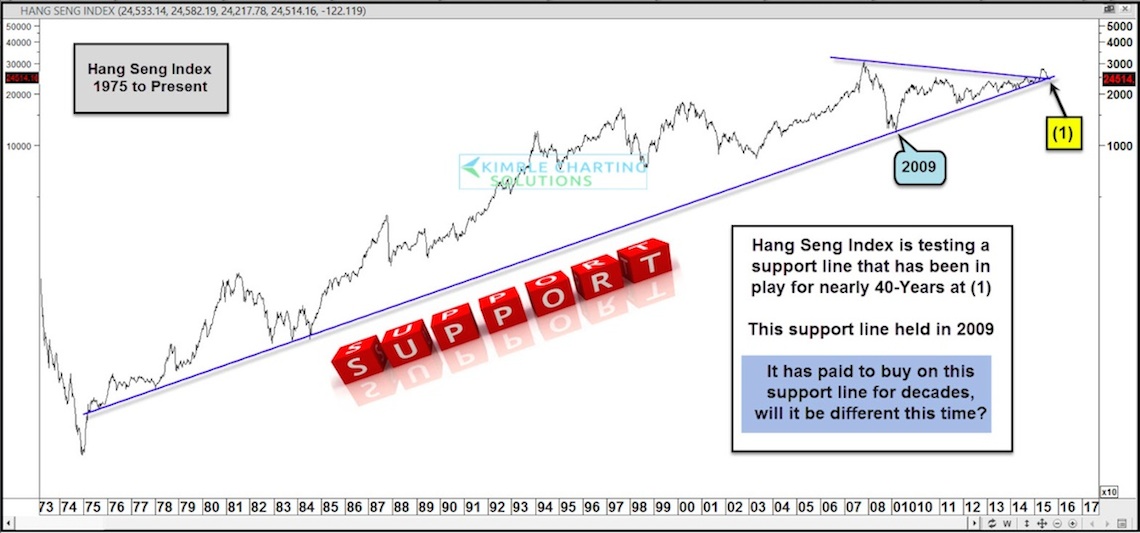
As investors were caught up in the Greek drama and commodities collapse, another near-term bubble burst: the Chinese stock market. And the drop has on of its major gauges nearing an important trend line. The Hang Seng Index is currently testing a 40 year uptrend support line. And although it’s probably a good idea to give it a little wiggle room, it’s an important trend line to monitor over the coming weeks/months.
Whether the Hang Seng Index holds support or breaks down through it may play an important role in what’s next for both the Chinese stock market as well as global stocks.
From a technical analysis perspective, it’s not very often that you you see a single trend support line that has been in play for this long. And if you look at the chart below, it has been tested multiple times over the years.
Hang Seng Index – 40 Year Chart
A couple things to note about this trend line:
- This support line came into play during the financial crisis in 2008-2009.
- Both the Hang Seng Index and the S&P 500 bottomed (together) in 1974-1975.
How the Hang Seng Index reacts at this major support level will be important going forward. It could impact U.S. markets (as well as markets around the world), so keep a close eye on how this plays out. Thanks for reading.
Twitter: @KimbleCharting
Author does not have a position in any mentioned securities at the time of publication. Any opinions expressed herein are solely those of the author, and do not in any way represent the views or opinions of any other person or entity.
")


")
