The past few months have seen shares of the world’s largest company, Apple Inc. (AAPL) trade sideways in a 12 dollar pattern. A couple of months of consolidation is expected after a big run higher. However, the stock has been rangebound for 4 months, and as time marches on the possibility of a bigger (more volatile) move increases.
Yesterday, I shared an important chart pattern for Apple (AAPL) on my blog. I’ve included it below as well. It entails two patterns that highlight a convergence of critical AAPL technical support levels. click to enlarge chart
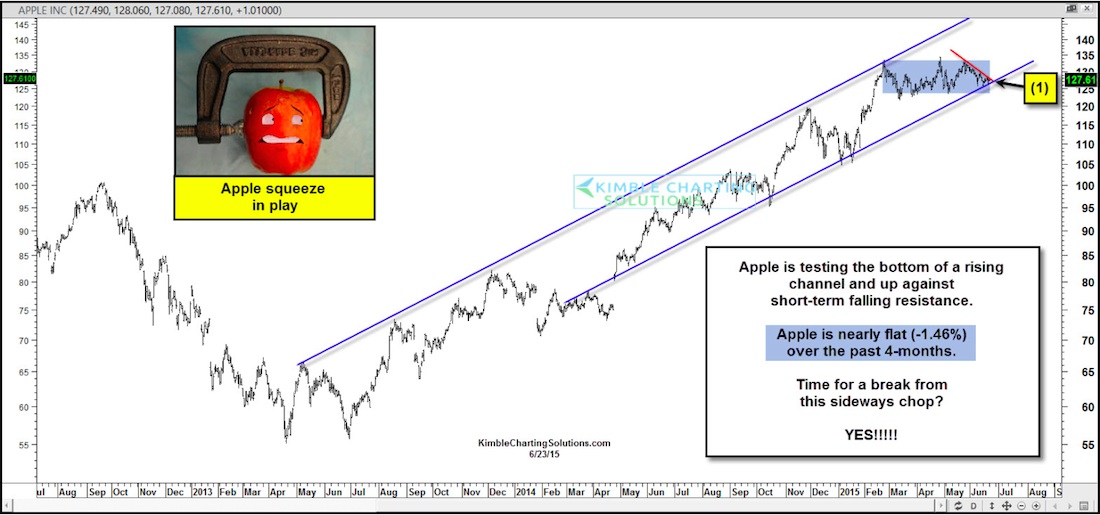
The first of two AAPL technical support levels resides at the bottom of the rising trend channel (see the highlighted number 1 on the chart above). That level is currently in play. The second support level is at the bottom of the recent 4 month sideways range. This comes into play around 122-124. This convergence of technical support is currently getting tested (note last week’s low was 125 and change).
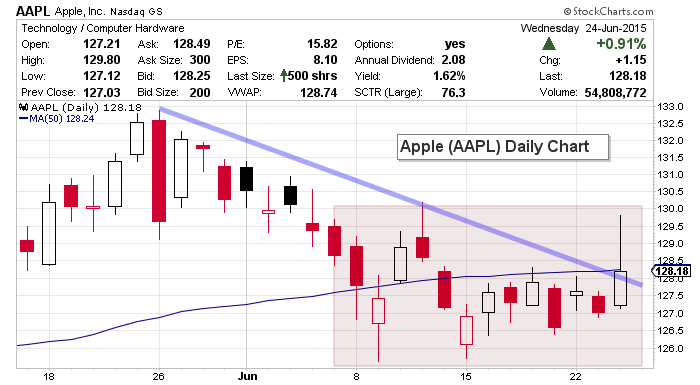
Today’s action was encouraging, as shares of Apple moved higher as the broader market went lower. AAPL attempted to take out its short-term downtrend line (and 50 day moving average) before declining mid-day and closing right on top of both of them. Investors will have to wait to see if the stock receives follow through buying in the days ahead… but keep an eye on the support levels below. Whether they hold may be the difference between the next move higher or lower.
Apple (AAPL) Stock Chart (ZOOM)
Thanks for reading.
Twitter: @KimbleCharting
Author does not have a position in any mentioned securities at the time of publication. Any opinions expressed herein are solely those of the author, and do not in any way represent the views or opinions of any other person or entity.


