 It’s been an interesting past two weeks in the financial markets. From the Fed build up to the surprise September FOMC statement and market reaction, active investors have been dealt a difficult hand. Waiting for confirmation can be difficult, but patience is a virtue in this type of environment. Below is a quick S&P 500 technical analysis update.
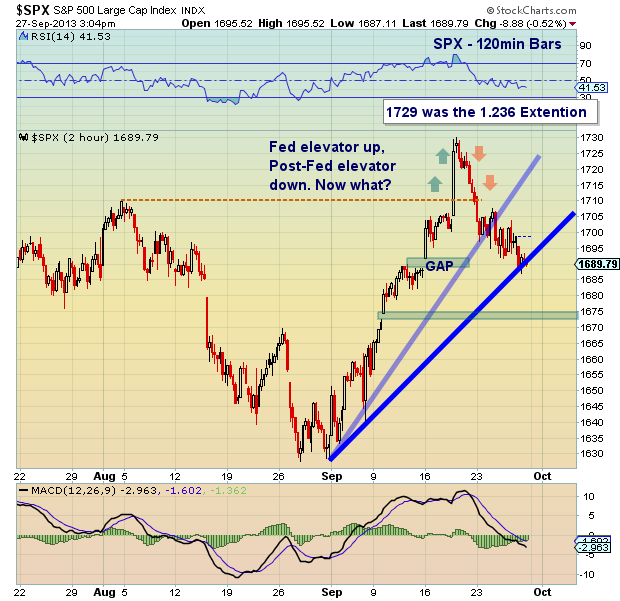
Note that the chart is simply a 120 min bar chart, so it is for short-term analysis. As noted in my pre-fed comments, when the market broke higher post-Fed, it made a b-line to the 1.236 extention at 1729. From there, it quickly reversed… and this leaves us watching key levels of support. Should the lower trend line break, the S&P 500 could slip to 1670-1675 (open gap area). This will be a level to watch. Note weekend “news” risk both ways. Trade safe, trade disciplined.
Twitter: @andrewnyquist @seeitmarket
No position in any of the mentioned securities at the time of publication. Any opinions expressed herein are solely those of the author, and do not in any way represent the views or opinions of any other person or entity.


