 By Andrew Nyquist
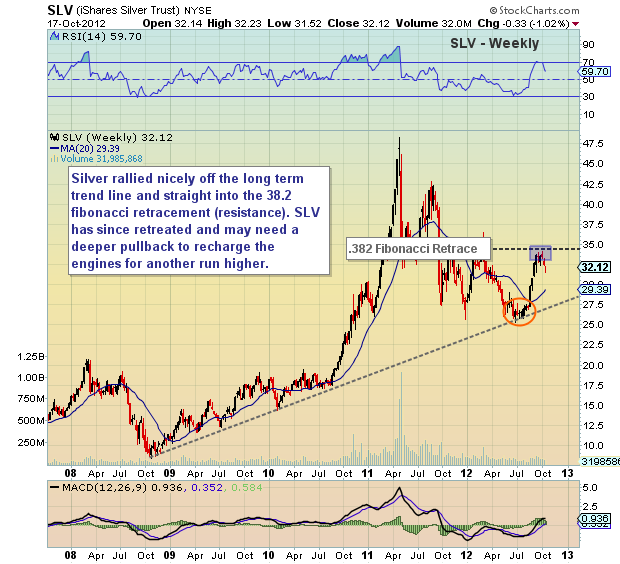
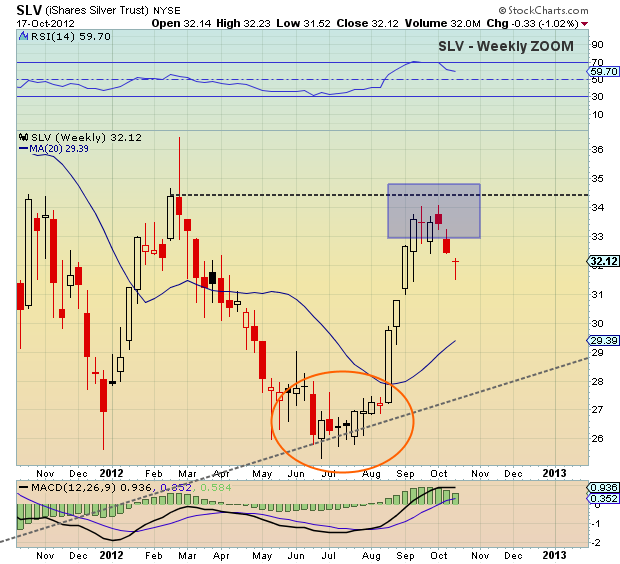
Due to time constraints this morning, I’m going to keep this a bit short and let the charts speak for themselves. In summary, Silver (SLV) was rejected by the 38.2 Fibonacci retracement level upon initial approach and has been heavy of late. But on the other hand, a stealth pullback may be necessary to recharge the batteries (see previous Silver chartology).
Keep in mind that the charts below use weekly bars, so they are less granular and more high level macro technical analysis charts.
Trade safe, trade disciplined.
More Charts here.
Silver (SLV) charts as of October 17, 2012. SLV charts with Fibonacci retracement levels and technical support and resistance. SLV long term chart with technical analysis.
———————————————————
Twitter: @andrewnyquist and @seeitmarket Facebook: See It Market
No position in any of the securities mentioned at the time of publication.
Any opinions expressed herein are solely those of the author, and do not in any way represent the views or opinions of his employer or any other person or entity.


