Last week I wrote a market update that speculated on whether Russell 2000 ETF (NYSEARCA: IWM) had put in a technical pattern called triple tops, or if it will clear the highs of 2021, 2024 and now 2025 and keep screaming higher.
A triple top pattern is a bearish technical analysis chart pattern that signals a potential reversal from an uptrend to a downtrend.
It forms when an asset’s price reaches a similar resistance level three times, failing to break higher on each attempt.
To confirm, a triple top means the price breaks below the support level drawn among the 3 peaks.
With the Russell 2000 ETF (IWM), the support level is lower at around 210-215. At this point we just do not know.
But we do know that IWM has rejected the highs for now.
And, if we look at the lows of the last 3 weeks, in sequence the prices are
235.42, 236.75, and this week 237.55. So far.
While I will not predict that this is anything more than a correction, I will get more concerned if we close this week under 237.55 as that breaks the pattern of consistent higher lows.
Meanwhile, IWM is still outperforming the benchmark
The momentum made a high at the peak price high in November 2024. If you look at the red dots, IWM did not match the 11/24 high in momentum even though the price recently made was higher than the price last November.
Something to watch.
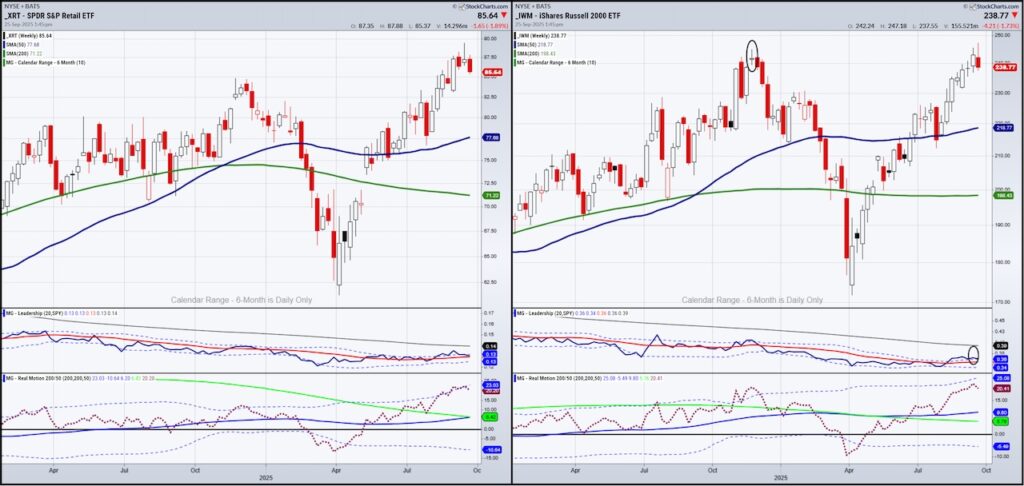
The Retail Sector ETF (XRT) made its peak high last week.
However, we must also note that the real all-time highs were made in 2021 at 104, so overall, this sector is underperforming compared to COVID times.
With that said, this week we are seeing a classic potential reversal top.
Should XRT close this week below the low of last week or under 86.46, we could assume a bigger correction is coming.
How big?
I would guess a trip down to the 80 area is possible.
XRT is now performing on par with the benchmark.
Momentum is flashing a mean reversion to the sell side.
Beyond that, we do not see a divergence between price and momentum.
Twitter: @marketminute
The author may have a position in mentioned securities at the time of publication. Any opinions expressed herein are solely those of the author and do not represent the views or opinions of any other person or entity.


")