Earnings season continues to ramp up this week. Now a more broad set of names report. Here’s another quick look at some of the bigger names on deck.
Tuesday Night features IBM and Wynn Resorts.
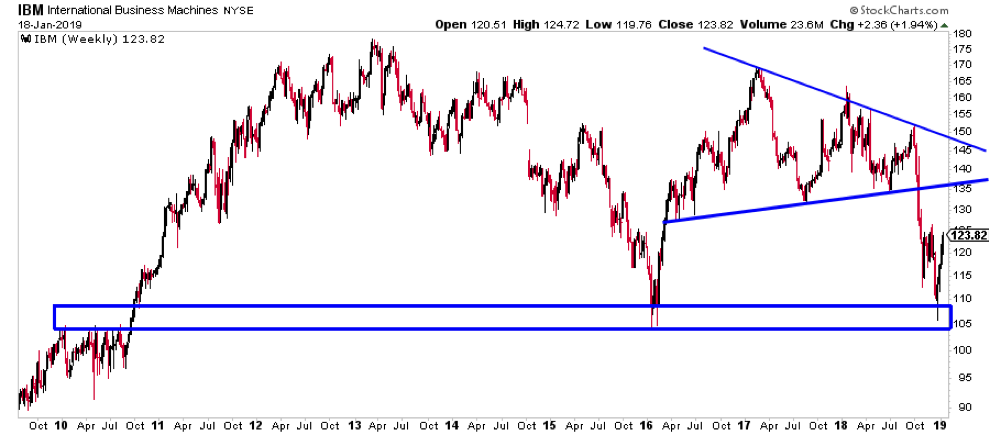
International Business Machines (IBM)
IBM had a rough 2018 dropping over 30% from high to low. It happened to bottom at a major support around 105.
Current trend resistance is roughly around 145. A notable past breakdown area is 130-135.
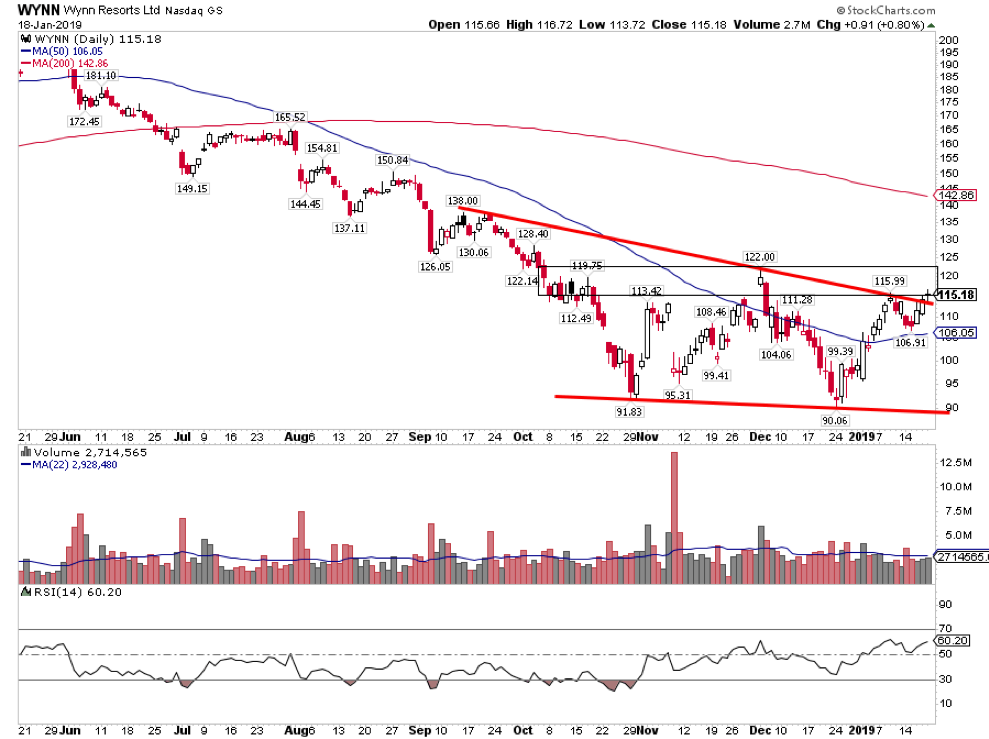
Wynn Resorts (WYNN)
WYNN is trying to leave the compression it has traded in since Labor Day. 116-122 has been resistance over the past quarter, but over that leaves plenty of room for a potential rally to the 200 day moving average around 140. However, failure to separate from resistance could take shares back to the bottom of the range around 90.
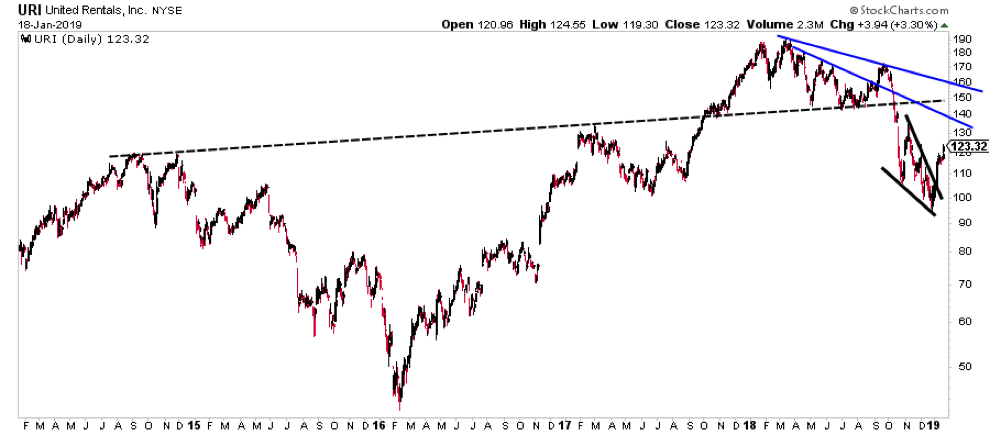
United Rentals (URI)
Wednesday Night United Rentals (URI) reports. In Q4 it formed a strong support area around 100, which remains support on any move lower. Upside area to watch include a trend resistance in the mid 130’s and most notably a resistance confluence in the 150s area.
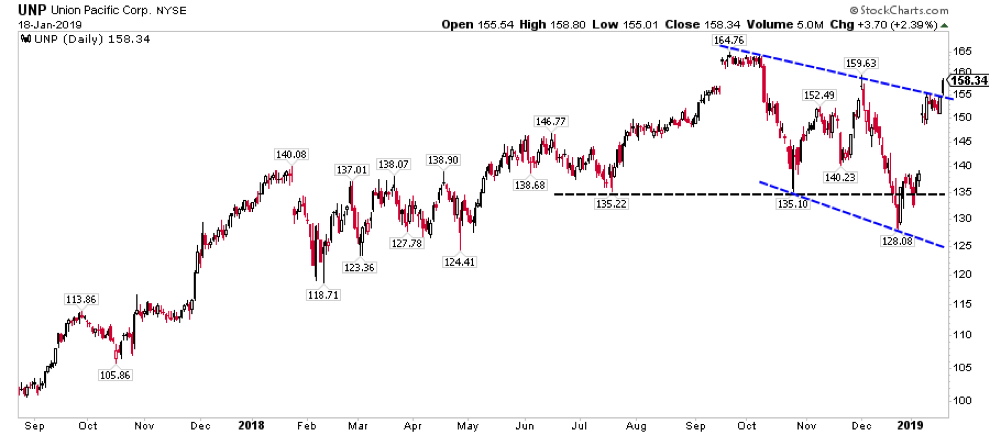
Union Pacific (UNP)
Thursday Morning Union Pacific (UNP), the largest publicly traded railroad in North America, reports. There really isn’t much to say here. The recent relative strength has been notable, but price has been trendless and sloppy.
Thursday Night is another popular earnings release night with many notable large caps including Intel and Starbucks leading the way.
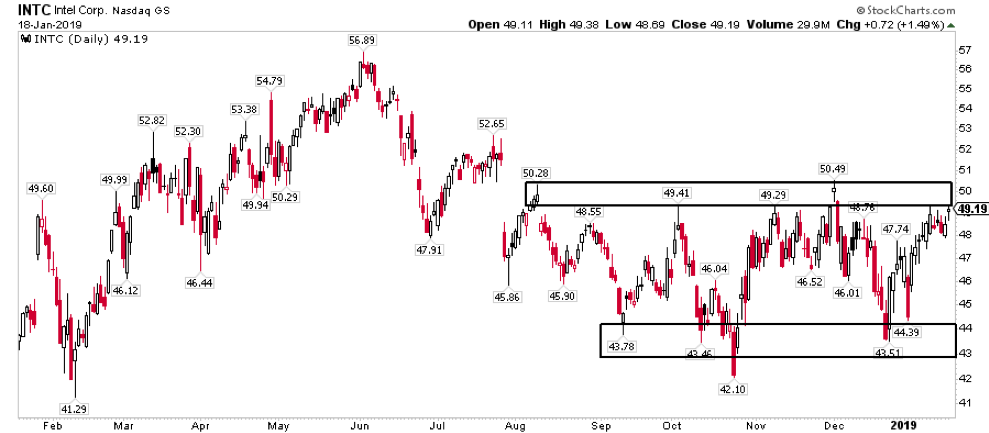
Intel Corp (INTC)
INTC has traded within this range for half of a year. Above it we can look for an attempt at the prior high around 57. Below it we can look for a move to the low end of the range around 43.
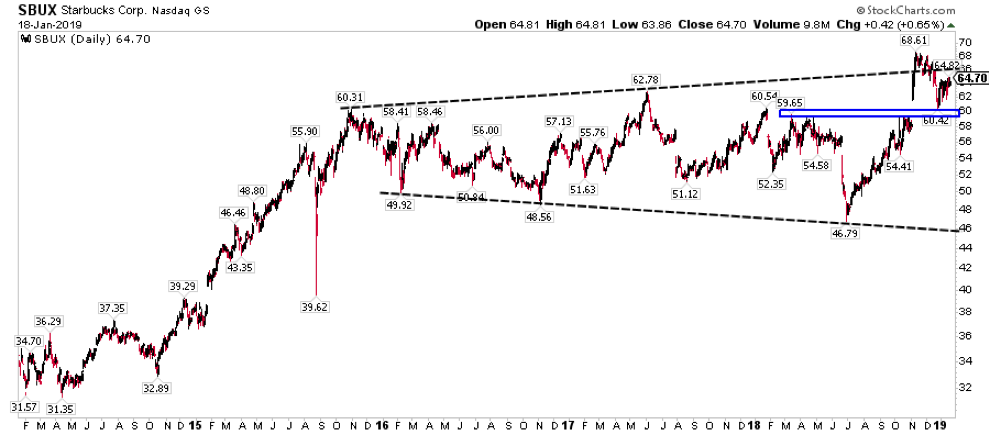
Starbucks (SBUX)
SBUX is one of the more tricky charts out there with a multi year broadening range. Given that price failed to sustain above the upper boundary, the risk appears to be to the downside.
That said, 59-60 is a significant price area for bulls to be long against. Below that area, the next notable areas on the downside include 55 and 50.
Thanks for reading. Trade ‘em well!
Twitter: @ATMcharts
Any opinions expressed herein are solely those of the author and do not in any way represent the views or opinions of any other person or entity.


